
Modello dell’insorgenza dei sintomi della malattia da Covid-19
 Joseph R. Larsen 1,2 ,
  Margaret R. Martin 3 ,
  John D. Martin 4 ,
  Peter Kuhn 2 * e
  James B. Hicks 2 *
- 1 Biologia Quantitativa e Computazionale, Dipartimento di Scienze Biologiche, University of Southern California, Los Angeles, CA, Stati Uniti
- 2 USC Michelson Center for Convergent Bioscience, University of Southern California, Los Angeles, CA, Stati Uniti
- 3 Nexus Development PA LLC, Redwood City, CA, Stati Uniti
- 4 NanoCarrier Co., Ltd., Chiba, Giappone
- fonte frontiersin.org
IN FONDO ALL’ARTICOLO L’ORIGINALE IN INGLESE
COVID-19 è una malattia virale pandemica con impatto globale catastrofico. Questa malattia è più contagiosa dell’influenza, tanto che si verificano frequentemente epidemie a grappolo. Se i pazienti con sintomi sono stati rapidamente sottoposti a test e tracciamento dei contatti, questi focolai potrebbero essere contenuti. Sfortunatamente, i pazienti COVID-19 hanno sintomi simili ad altre malattie comuni. Qui, ipotizziamo che l’ordine in cui si verificano i sintomi possa aiutare i pazienti e gli operatori sanitari a distinguere più rapidamente COVID-19 da altre malattie respiratorie, tuttavia tali informazioni essenziali sono in gran parte non disponibili. A tal fine, applichiamo un processo di Markov a un set parzialmente ordinato classificato sulla base di osservazioni cliniche di casi COVID-19 per accertare l’ordine più probabile dei sintomi distinguibili (ad esempio, febbre, tosse, nausea / vomito e diarrea) in COVID- 19 pazienti. Abbiamo quindi confrontato la progressione di questi sintomi nel COVID-19 con altre malattie respiratorie, come influenza, SARS e MERS, per osservare se le malattie si presentano in modo diverso. Il nostro modello prevede che l’influenza inizi con la tosse, mentre COVID-19 come altre malattie correlate al coronavirus inizia con la febbre. Tuttavia, COVID-19 differisce da SARS e MERS nell’ordine dei sintomi gastrointestinali. I nostri risultati supportano l’idea che la febbre dovrebbe essere utilizzata per controllare l’ingresso nelle strutture quando le regioni iniziano a riaprire dopo lo scoppio della primavera 2020. Inoltre, i nostri risultati suggeriscono che una buona pratica clinica dovrebbe includere la registrazione dell’ordine di comparsa dei sintomi in COVID-19 e altre malattie. Se una tale pratica clinica sistemica fosse stata standard fin dalle antiche malattie,
introduzione
L’attuale pandemia di Coronavirus Disease 2019 (COVID-19), causata dalla sindrome respiratoria acuta grave coronavirus 2 (SARS-CoV-2), ha subito un aumento esponenziale osservato di casi che ha invaso gli ospedali di tutto il mondo ( 1 ). Molte persone hanno forme lievi della malattia e si consiglia di non recarsi in ospedale o di fare un test diagnostico perché possono riprendersi a casa. Un gran numero di altri sono asintomatici ( 2 ). Gli individui infetti sono altamente contagiosi e possono trasmettere la malattia anche se sono asintomatici, e questo fatto favorisce la necessità di isolare e testare spesso ( 2 ). Inoltre, COVID-19 è da due a tre volte più contagioso dell’influenza ( 3). A causa di queste caratteristiche, focolai di COVID-19 si verificano in gruppi ( 4 ). L’identificazione precoce di COVID-19 potrebbe ridurre il numero e la dimensione dei cluster, ma i primi sintomi non sono ben definiti. Il Center for Disease Control and Prevention (CDC) negli Stati Uniti e l’Organizzazione mondiale della sanità (OMS) attualmente consigliano al pubblico di chiamare il proprio medico se ritengono di essere stati esposti a COVID-19 o manifestano febbre e tosse ( 5 ). Tuttavia, febbre e tosse sono associate ad altre malattie respiratorie come l’influenza ( 6 – 8 ). L’influenza, con un numero stimato di casi sintomatici nell’ordine di milioni all’anno solo negli Stati Uniti ( 9 ), è anche comunemente associata a febbre e tosse ( 6). Analogamente a COVID-19, la sindrome respiratoria del Medio Oriente (MERS) e la sindrome respiratoria acuta grave (SARS) sono malattie respiratorie contratte dai coronavirus chiamati Coronavirus correlato alla MERS (MERS-CoV) e Coronavirus correlato alla SARS (SARS-CoV) , rispettivamente ( 7). I sintomi di queste malattie si sovrappongono anche a COVID-19. La capacità di discernere le differenze in questi sintomi comuni, come l’ordine in cui si verificano e i probabili primi sintomi, aiuterebbe nel riconoscimento precoce. Se gli operatori sanitari registrassero e pubblicassero sequenze di sintomi osservate clinicamente e / o riferite dai pazienti, i dati riportati potrebbero essere valutati come uno strumento aggiuntivo per il riconoscimento precoce di COVID-19 per aumentare l’auto-sorveglianza e ridurre la diffusione. Se una pratica clinica così diffusa fosse stata istituita in passato, forse focolai locali di influenze, coronavirus e altre malattie avrebbero potuto essere contenuti prima di diventare pandemie.
A tal fine, abbiamo ipotizzato che i sintomi e il loro ordine siano variabili indipendenti e abbiamo creato un modello che approssima la probabilità che i sintomi si manifestino in ordini specifici utilizzando i dati dei pazienti disponibili e non ordinati. L’uso di questi presupposti e dati era necessario data la mancanza di dati ordinati. Per fare ciò, abbiamo applicato un processo Markov per determinare l’ordine di comparsa dei sintomi comuni delle malattie respiratorie. Abbiamo usato in precedenza una catena di Markov per predire le metastasi del cancro posizione ( 10 – 14 ). Un processo di Markov è definito come una sequenza stocastica di eventi in cui la probabilità del prossimo stato dipende solo dallo stato attuale piuttosto che da stati passati o futuri ( 15). In questo caso, abbiamo definito ogni stato come i sintomi specifici che un paziente ha sperimentato e ogni transizione dipende solo da questi sintomi. Di conseguenza, possiamo determinare gradualmente la probabilità di ogni sintomo utilizzando un processo di Markov. Abbiamo definito la probabilità di stato di un nodo come la frequenza con cui un paziente ha una particolare combinazione di sintomi divisa per il numero totale di pazienti che presentano lo stesso numero di sintomi. La probabilità di transizione tra due stati è definita come la probabilità di acquisire un singolo sintomo specifico divisa per la probabilità di acquisire tutti i possibili sintomi successivi. Abbiamo quindi applicato un approccio algoritmico avido utilizzando le probabilità di transizione per calcolare la probabilità di tutti i possibili ordini di determinare gli ordini di sintomi più e meno probabili.
In questo studio, abbiamo prima definito questa specifica applicazione di un processo di Markov applicato a un insieme parzialmente ordinato (poset) classificato, che chiamiamo modello di progressione stocastica. In questo caso, il nostro poset graduato rappresenta tutte le possibili combinazioni di sintomi e tutti i possibili ordini di comparsa dei sintomi. È classificato perché le possibili combinazioni di sintomi sono classificate in base al numero di sintomi che rappresentano ciascuna. Ad esempio, la combinazione di sintomi di febbre e tosse ha lo stesso valore della combinazione di tosse e diarrea. Abbiamo scoperto che il modello di progressione stocastica per gli adulti che sono sintomatici indica che può esserci un ordine di sintomi distinguibili in COVID-19, ma l’ordine dei sintomi sembra essere indipendente dalla gravità del caso al momento del ricovero. Da li, abbiamo confrontato l’ordine più probabile dei sintomi in altre malattie respiratorie con COVID-19. Per espandere i nostri risultati, abbiamo analizzato una serie più ampia di sintomi comuni a tutte le malattie respiratorie studiate qui e abbiamo cercato di decifrare ulteriori distinzioni.
Materiali e metodi
Raccolta dati
I dati dei pazienti da questo studio sono stati raccolti da vari rapporti in letteratura sulle frequenze dei sintomi in COVID-19, influenza, MERS e SARS ( tabelle supplementari 1 , 2 ). Ogni set di dati è stato utilizzato per approssimare l’ordine dei sintomi, per confermare i nostri risultati o per analizzare i primi sintomi nel COVID-19 o nell’influenza. Per tutte queste applicazioni, abbiamo utilizzato i dati dei pazienti riportati per simulare pazienti con varie combinazioni di sintomi sperimentati e quindi applicato i dati simulati per eseguire le analisi.
Il set di dati principale dei pazienti COVID-19 dell’Organizzazione Mondiale della Sanità, contenente 55.924 casi confermati, è stato ottenuto attraverso la revisione dei rapporti governativi nazionali e locali e delle osservazioni effettuate durante le visite alle aree con individui infetti in Cina avvenute dal 16 al 24 febbraio 2020 ( 8 ). Un set di dati di conferma dei pazienti COVID-19, contenente 1.099 casi confermati, è stato ottenuto dal China Medical Treatment Expert Group per COVID-19 dalle cartelle cliniche e da altri dati raccolti di pazienti ospedalizzati e pazienti ambulatoriali a cui è stato diagnosticato COVID-19. Questi dati sono stati segnalati alla Commissione sanitaria nazionale cinese dall’11 dicembre 2019 al 29 gennaio 2020 ( 16). Per entrambi i set di dati COVID-19, la mialgia è stata segnalata come mialgia o artralgia. Abbiamo ipotizzato che la maggior parte dei pazienti con mialgia avesse anche artralgia, quindi abbiamo utilizzato la frequenza della mialgia o dell’artralgia come frequenza per la mialgia durante la simulazione dei dati. Il set di dati sull’influenza, contenente 2.470 casi confermati, è stato raccolto dai ricercatori dell’Università del Michigan da un’analisi aggregata retrospettiva di pazienti per lo più non vaccinati che partecipavano a studi clinici di fase 2 e 3 condotti in Nord America, Europa e nell’emisfero meridionale dal 1994 al 1998 ( 6). Questo gruppo di pazienti ha un’età media di 35 anni e ognuno ha mostrato più sintomi. Vomito e diarrea non sono stati riportati in questo set di dati sull’influenza, ma sono comuni tra le malattie respiratorie. Sebbene i pazienti adulti a volte possano manifestare vomito e diarrea se infettati dall’influenza, questi sintomi sono rari ( 17 ). Pertanto, in questo caso approssimiamo la frequenza di questi sintomi a 0,010. I set di dati che rappresentano la frequenza dei sintomi nella MERS, contenente 245 pazienti, e nella SARS, contenente 357 pazienti, sono stati raccolti al momento del ricovero e sono stati riportati come dati clinici dai medici, il dottor Yin, al Beijing Chao-Yang Hospital e il dottor Wunderink, al Northwestern University Feinberg School of Medicine ( 7). I pazienti inclusi in questi set di dati variavano per età e condizioni preesistenti. Nei casi di SARS, i pazienti tendevano ad essere più giovani e ad avere meno condizioni preesistenti rispetto ai casi di MERS.
Abbiamo utilizzato i dati sulla frequenza iniziale di MERS e SARS per accertare ulteriormente i primi sintomi della malattia. Il set di dati sulla frequenza dei sintomi iniziali MERS, contenente 45 casi confermati, è stato raccolto da cartelle cliniche elettroniche presso il Samsung Medical Center di Seoul, Corea del Sud, che conteneva dati sui sintomi di insorgenza sui pazienti nell’epidemia di MERS coreana del 2015 ( Tabella supplementare 3 ) ( 18 ). Il set di dati sulla frequenza dei sintomi iniziali della SARS, contenente 144 casi confermati, è stato raccolto dai registri ospedalieri, comprese le informazioni sui primi sintomi nei pazienti risalenti al 7 marzo al 10 aprile 2003 durante un’epidemia nell’area metropolitana di Toronto ( Tabella supplementare 4 ) ( 19 ).
Infine, sono stati raccolti due ulteriori set di dati per determinare l’utilità di utilizzare i primi sintomi come primi indicatori di COVID-19 e influenza. Il set di dati COVID-19 utilizzato, contenente 138 pazienti, era indipendente da tutti i precedenti set di dati COVID-19. Questi dati sono stati ottenuti dalle cartelle cliniche elettroniche dei pazienti ricoverati all’ospedale Zhongnan dell’Università di Wuhan dall’1 al 28 gennaio 2020 ( 20). I dati sui sintomi sono stati raccolti all’inizio della malattia e tutti i pazienti hanno manifestato polmonite dovuta a COVID-19. In questo set di dati, nausea e vomito sono stati riportati separatamente per COVID-19. Abbiamo ipotizzato che la maggior parte dei pazienti che manifestano vomito, che viene segnalato con una frequenza di 0,036, soffrano anche di nausea, che viene riportata con una frequenza di 0,101, e quindi per simulare i dati, abbiamo definito la frequenza per nausea / vomito come 0,101. Il set di dati sull’influenza utilizzato riportava 20 casi confermati di influenza e 400 casi negativi confermati di influenza ed è indipendente da qualsiasi altro set di dati sull’influenza che abbiamo usato ( 21). I dati sui sintomi sono stati raccolti attraverso questionari e osservazioni da professionisti medici durante le stagioni influenzali del 2006 e 2007 di pazienti infetti ricoverati presso il Dipartimento di Medicina Interna e Malattie Infettive e il Dipartimento di Pneumologia presso il Centro medico universitario di Utrecht. Come per l’altro set di dati sull’influenza sopra descritto, vomito e diarrea non sono stati riportati in questo set di dati. Quindi, ancora una volta abbiamo assunto che la frequenza di questi sintomi fosse 0,010 ( 17 ). Poiché questo studio è stato condotto nel 2006 e nel 2007, prima dell’epidemia di COVID-19, abbiamo ipotizzato che anche questi pazienti fossero negativi per COVID-19. Quindi, questo gruppo di 400 pazienti è stato utilizzato come set di dati che rappresenta gli individui negativi sia per COVID-19 che per l’influenza ( Tabella supplementare 5 ).
Simulazione della progressione dei sintomi dai dati del paziente
Lo Stochastic Progression Model è stato costruito in R nella versione 3.5.2 ed è stato illustrato utilizzando la funzione hasse nella libreria hasseDiagram_0.1.3 (codice disponibile online: https://github.com/j-larsen/Stochastic_Progression_of_COVID-19_Symptoms ) ( 22 , 23). Ciascun rapporto di malattia respiratoria era rappresentato da un frame di dati corrispondente, con colonne come sintomi, una riga come frequenza dei sintomi osservati nello studio e l’altra riga come frequenza moltiplicata per 1.000. Il multiplo della frequenza è definito come il conteggio della frequenza, che rappresenta la probabilità di un sintomo in un campione teorico di 1.000 pazienti simulati. Inoltre, lo stato di un individuo viene visualizzato attraverso una serie di caratteri di uno e zeri, dove gli uno rappresentano la presenza di un sintomo e gli zero rappresentano la sua assenza. Questo processo di simulazione di un sintomo è analogo a un barattolo di biglie di due colori. La probabilità di estrarre un colore di marmo (cioè un sintomo specifico) è illustrata dal conteggio della frequenza perché il numero totale di biglie nel barattolo è 1,
Abbiamo quindi simulato i dati di 500.000 pazienti, selezionando casualmente se un paziente ha o meno un sintomo utilizzando la procedura descritta sopra e memorizzando tali informazioni in un frame di dati che rappresenta i pazienti come righe e i sintomi come colonne. Abbiamo ipotizzato che il verificarsi dei sintomi fosse casuale e indipendente. Tenendo conto di questi presupposti, abbiamo costruito gli array di caratteri applicando il metodo del barattolo di biglie per ogni paziente simulato. Il metodo si ripete per ogni paziente e prevede di estrarre una biglia da una serie di barattoli che rappresentano ogni sintomo. Le informazioni da ciascuna biglia estratta a caso sono memorizzate nella cella corrispondente della matrice di caratteri nella colonna corretta che rappresenta il sintomo e la riga che rappresenta il paziente simulato. Questo processo viene ripetuto per tutti i 500.000 pazienti simulati per tutti i sintomi.
Costruire il modello di progressione stocastica
Il modello di progressione stocastica è illustrato come un grafo aciclico diretto con nodi, che rappresentano l’insieme di potenza dei vettori booleani. I set di potenza dei vettori booleani rappresentano ciascuno un possibile stato di un paziente rilevando l’assenza o la presenza di sintomi specifici. I bordi, che illustrano la transizione da uno stato a un altro, sono stati selezionati specificamente utilizzando definizioni chiave e ipotesi per creare un poset. Abbiamo definito gli stati ai nodi come sintomi che un paziente ha sperimentato fino a questo punto. Abbiamo creato e diretto bordi da stati con meno sintomi a più partendo dall’insieme minimo di un vettore booleano di tutti zeri, che indica una persona senza sintomi. Innanzitutto, assumiamo che ogni sintomo si manifesti uno alla volta, anche se la differenza di tempo è infinitesimale. Con questa ipotesi, un nodo può essere diretto solo ad altri nodi che denotano lo stesso insieme di sintomi più un sintomo aggiuntivo. In secondo luogo, assumiamo che se un paziente non divaga e non muore, alla fine acquisirà tutti i sintomi raggiungendo l’insieme massimo di un vettore booleano, che rappresenta un paziente che ha mostrato tutti i sintomi. L’applicazione di queste ipotesi per formare il grafo aciclico diretto crea un diagramma di Hasse di un poset graduato che segue un processo di Markov che comprende complessivamente il modello di progressione stocastica.
Calcolo delle probabilità di stato e di transizione
I nodi nel diagramma di Hasse rappresentano gli stati di un paziente indicando i sintomi specifici esibiti e i bordi rappresentano le transizioni tra questi stati. Quindi, abbiamo poi dovuto applicare le probabilità di stato a ciascun nodo e le probabilità di transizione ai bordi diretti. Innanzitutto, abbiamo etichettato ogni paziente simulato sommando il rispettivo vettore booleano per trovare il numero di sintomi per ogni paziente. Quindi, per ottenere la probabilità di stato di ciascun nodo, abbiamo diviso il numero di pazienti simulati rappresentati dal vettore booleano corrente per il numero totale di pazienti che hanno lo stesso numero di sintomi. Per approssimare la probabilità di transizione tra due nodi (di origine e di terminazione), abbiamo diviso il numero di pazienti simulati rappresentati dal nodo terminale per il numero di pazienti simulati rappresentati da nodi caratterizzati dallo stesso numero di sintomi del nodo terminale, compreso il nodo terminale. L’errore di ogni nodo è determinato dalla somma dei prodotti delle probabilità di transizione che portano a quel nodo, sottratte dalla probabilità di stato del nodo. Quindi, l’errore di ciascuna implementazione del modello è stato definito come l’errore del nodo con il valore assoluto più alto di errore (Figure supplementari 2 – 13). Le probabilità di transizione indicano le probabilità di transizioni da un nodo a un altro e gli aggregati delle probabilità di transizione in una sequenza rappresentano le probabilità dei percorsi. Questi percorsi illustrano l’ordine dei sintomi quando si è infettati da una malattia respiratoria osservando l’aggiunta graduale dei sintomi quando si attraversano i nodi del percorso. I percorsi più e meno probabili sono stati determinati utilizzando un approccio algoritmico avido. Questo approccio consiste nella selezione graduale dei bordi massimi o minimi locali, il che si traduce rispettivamente in un percorso più e meno probabile. Se la probabilità di transizione massima (o minima) da un nodo specifico rientrava nell’errore di altre probabilità di transizione di archi dallo stesso nodo di origine, abbiamo raggruppato i nodi di terminazione quando abbiamo trovato il percorso più (o meno) probabile. In questi casi, non siamo riusciti a distinguere una differenza di probabilità tra queste transizioni specifiche. I percorsi creano un possibile ordine di sintomi tramite il poset, ciascuno con una specifica probabilità di accadimento.
Risultati
Un possibile ordine di sintomi distinguibili in COVID-19
Il rapporto congiunto OMS-Cina dal 16 al 24 febbraio 2020 include i tassi di comparsa dei sintomi alla presentazione da 55.924 casi confermati di COVID-19 ( 8 ). Abbiamo identificato sintomi che erano facilmente distinguibili o oggettivi (cioè, febbre, tosse, diarrea e nausea / vomito) rispetto ad altri sintomi riportati, come infiammazioni degli epiteli dei vasi sanguigni ( 24 ), effetti neurologici ( 25 ) e rash- sintomi simili ( 26 ). Questi sintomi sono comuni anche in altre malattie respiratorie. Pertanto, abbiamo scelto di implementare questi quattro sintomi nel modello di progressione stocastica ( Tabella supplementare 1). Per confermare la validità del modello, abbiamo prima determinato le possibili sequenze di occorrenza dei sintomi quando le probabilità sono uniformemente casuali per ciascun sintomo. Oltre a tutti i possibili ordini di occorrenza dei quattro sintomi, il diagramma mostra i percorsi più e meno probabili dei quattro sintomi, rappresentati rispettivamente da linee rosse e linee blu ( Figure 1A, B ). I percorsi più e meno probabili descrivono la serie di sintomi più e meno probabile che una persona infetta a caso dalla popolazione nel set di dati potrebbe sperimentare. In questo caso, ogni possibile percorso è ugualmente probabile, senza alcun percorso che abbia una probabilità maggiore di qualsiasi altro.
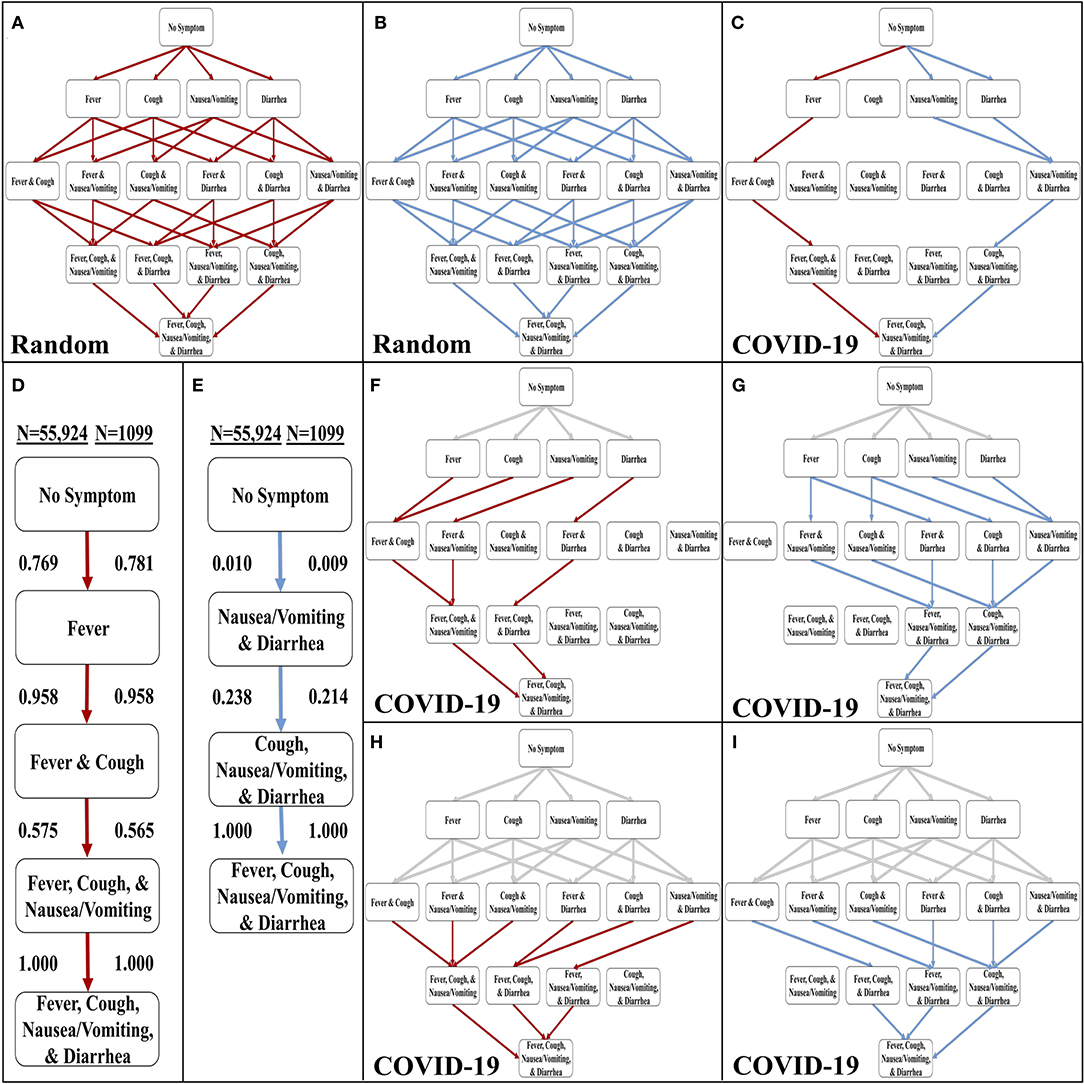 Figura 1 . Sviluppo del modello di progressione stocastica per COVID-19. (A) I percorsi più probabili (rossi) nel diagramma di Hasse per i sintomi con probabilità che si verifichino casualmente. (B) I percorsi meno probabili (blu) nel diagramma di Hasse per i sintomi con probabilità casuale di verificarsi. (C) Il percorso più probabile (rosso) e meno probabile (blu) nel diagramma di Hasse per i sintomi in COVID-19. (D) L’ordine più probabile dei sintomi in COVID-19 basato sul nostro modello di progressione stocastica determinato dalle probabilità di transizione presentate qui. (E) L’ordine meno probabile dei sintomi in COVID-19 basato sul nostro modello di progressione stocastica determinato dalle probabilità di transizione presentate qui. (F)Hasse Diagramma dei percorsi più probabili (rosso) dopo aver percorso un percorso forzato (grigio) di pazienti con un sintomo. (G) Hasse Diagramma dei percorsi meno probabili (blu) dopo aver percorso un percorso forzato (grigio) di pazienti con un sintomo. (H) Hasse Diagramma dei percorsi più probabili (rosso) dopo aver percorso un percorso forzato (grigio) di pazienti con due sintomi. (I) Hasse Diagramma dei percorsi meno probabili (blu) dopo aver percorso un percorso forzato (grigio) di pazienti con due sintomi.
Abbiamo quindi creato un’altra implementazione del modello di progressione stocastica e utilizzato i dati nel rapporto congiunto OMS-Cina (COVID-19 con N = 55.924) ( 8 ). Con questa implementazione, abbiamo determinato i percorsi più e meno probabili ( Figura 1C ). In questo caso, è molto probabile che una persona infetta da COVID-19 manifesti sintomi nell’ordine di febbre, tosse, nausea / vomito, quindi diarrea ( Figura 1D ). Il percorso meno probabile inizia con diarrea e nausea / vomito ed è seguito da tosse e infine febbre ( Figura 1E ). Abbiamo confermato questi risultati con un set di dati più piccolo (COVID-19 con N = 1.099) ( Figure 1D, E e Figura 1 supplementare ) (16 ). Le probabilità di passare alla febbre, 0,769, e quindi alla tosse, 0,958, sono elevate e queste osservazioni indicano che una gran parte dei pazienti sintomatici infetti può seguire questo percorso. Infine, questa implementazione del modello prevede che la nausea / vomito si verifichi prima della diarrea. Questi due risultati suggeriscono che nei pazienti con SARS-CoV-2, il corpo sviluppa prima febbre, poi sintomi respiratori superiori e infine sintomi del tratto gastrointestinale (GI) superiore e poi inferiore.
Per indagare ulteriormente su questi percorsi dei sintomi, abbiamo implementato il modello di progressione stocastica con il set di dati principale (COVID-19 con N = 55,924) ( 8 ), per determinare i probabili percorsi a valle quando i primi uno o due sintomi sono costretti a un certo stato ( Figure 1F – I ). Le linee grigie rappresentano i percorsi “forzati”. Il resto dei percorsi sono stati determinati come prima con un avido approccio algoritmico. Abbiamo riscontrato che gli ordini più probabili del percorso a valle sono coerenti con gli ordini più probabili dei percorsi non forzati. Anche se il primo sintomo è costretto a essere improbabile (p. Es., Diarrea), i percorsi a valle mantengono l’ordine più probabile degli altri tre sintomi che abbiamo originariamente determinato ( Figura 1F). Allo stesso modo, gli effetti del tratto GI si verificano per primi nei percorsi meno probabili forzati ( Figura 1G ). Quando si forza il percorso a un ulteriore passo predeterminando i primi due sintomi sia per il percorso più probabile che per quello meno probabile, i risultati rimangono gli stessi ( Figure 1H, I ).
L’ordine dei sintomi distinguibili in COVID-19 è indipendente dalla gravità della malattia al momento del ricovero
Il set di dati di conferma dei casi COVID-19 ( N = 1.099) separa i 1.099 casi segnalati tra pazienti gravi e non gravi come designato al momento del ricovero ( 16 ). Per investigare gli effetti della gravità sull’ordine dei sintomi distinguibili, abbiamo implementato ogni serie di casi separatamente utilizzando il modello di progressione stocastica. Abbiamo scoperto che i percorsi più e meno probabili sono identici nei casi gravi e non gravi e ai nostri risultati originali sopra ( Figura 2). Per illustrare le somiglianze, la più grande differenza di probabilità si osserva quando si passa dall’assenza di sintomi alla febbre nel percorso più probabile. Nei casi gravi e non gravi, la probabilità è rispettivamente di 0,775 e 0,818, indicando una differenza di 0,043. Questi risultati suggeriscono che la gravità non influisce sull’ordine dei sintomi distinguibili e sono coerenti con l’ipotesi della febbre come primo sintomo di COVID-19.
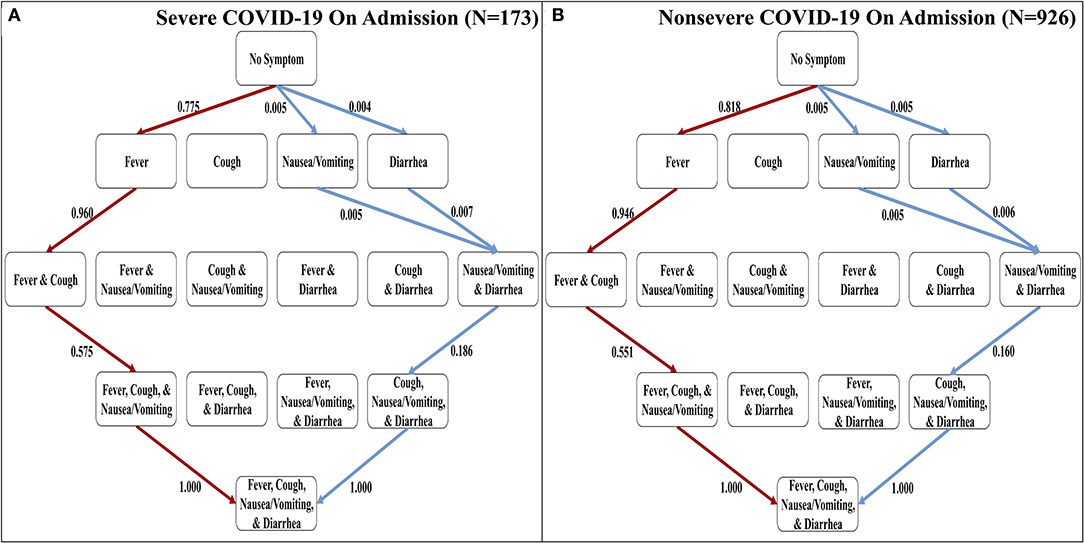 Figura 2 . I percorsi più e meno probabili di sintomi distinguibili nei casi COVID-19 gravi e non gravi al momento del ricovero. (A) Diagramma di Hasse dei percorsi più probabili (rosso) e dei percorsi meno probabili (blu) in COVID-19 per i casi designati come gravi al ricovero determinato dalle probabilità di transizione qui presentate. (B) Diagramma di Hasse dei percorsi più probabili (rosso) e dei percorsi meno probabili (blu) in COVID-19 per i casi designati come non gravi all’ammissione determinati dalle probabilità di transizione presentate qui.
Variazione dell’ordine dei sintomi distinguibili tra malattie respiratorie
I quattro sintomi distinguibili sono oggettivi e relativamente facili da confermare per pazienti e medici. Quindi, abbiamo sviluppato implementazioni del modello di progressione stocastica utilizzando questi sintomi per determinare i percorsi più probabili e meno probabili per quattro malattie respiratorie: COVID-19, influenza, MERS e SARS ( Figure 3A – D ) ( 6 – 8 ). L’ordine di comparsa più probabile dei sintomi in COVID-19 è febbre, tosse, nausea / vomito e diarrea ( Figura 3A ). Questo percorso è identico all’influenza, tranne per il fatto che l’ordine dei due sintomi iniziali è cambiato ( Figura 3B ). D’altra parte, i percorsi più probabili previsti (cioè febbre, tosse, diarrea e quindi nausea / vomito) sono gli stessi per MERS e SARS (Figure 3C, D). Questo ordine ha una differenza dal percorso più probabile in COVID-19 in quanto l’ordine degli ultimi due sintomi è invertito. Il percorso meno probabile della MERS inizia con nausea / vomito o diarrea come primo passo. Questi passaggi sono seguiti da tosse e infine febbre. Al contrario, il percorso meno probabile della SARS è tosse, nausea / vomito e diarrea in qualsiasi ordine, e infine febbre. Tuttavia, il percorso meno probabile dei sintomi nel COVID-19 è lo stesso del percorso meno probabile nella MERS e il percorso meno probabile dell’influenza è unico rispetto alle altre malattie. Non è rilevabile se nausea / vomito o diarrea siano i primi sintomi dell’influenza, ma dopo questi due, il percorso meno probabile continua da lì alla febbre e poi alla tosse. Questa osservazione illustra ulteriormente il forte legame tra la tosse e l’influenza.
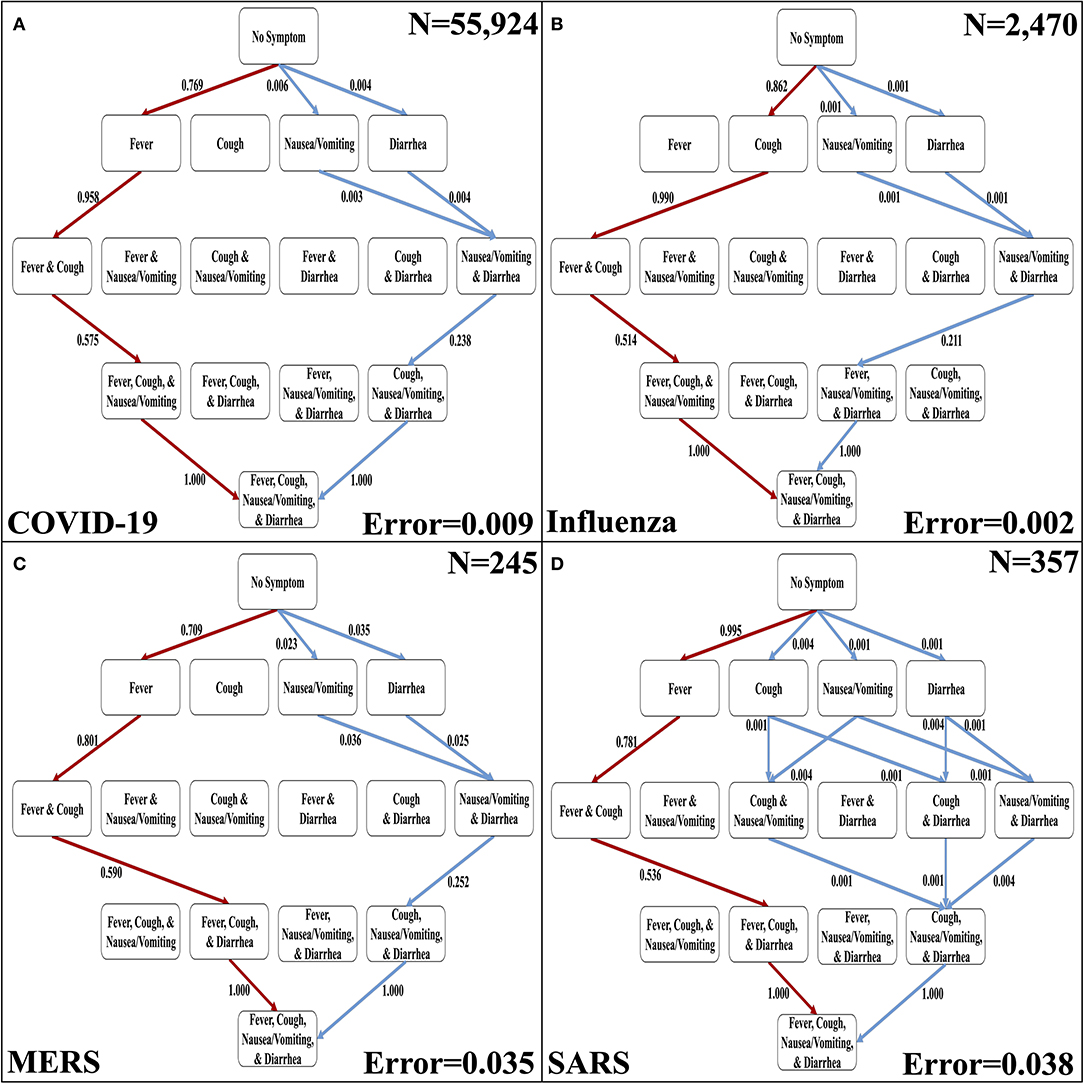 Figura 3 . I percorsi più probabili e meno probabili dei sintomi distinguibili nelle malattie respiratorie. (A) I percorsi più probabili (rosso) e quelli meno probabili (blu) in un diagramma di Hasse per i sintomi di COVID-19. (B) I percorsi più probabili (rossi) e meno probabili (blu) in un diagramma di Hasse per i sintomi dell’influenza. (C) I percorsi più probabili (rosso) e quelli meno probabili (blu) in un diagramma di Hasse per i sintomi della MERS. (D) I percorsi più probabili (rosso) e quelli meno probabili (blu) in un diagramma di Hasse per i sintomi della SARS. Per ogni diagramma, i percorsi più e meno probabili sono determinati dalle probabilità di transizione che sono rappresentate sui bordi. Inoltre, l’errore delle probabilità di transizione e la dimensione del campione ( N) sono presentati.
Confronto dell’ordine dei sintomi più comuni nelle malattie respiratorie con COVID-19
Sebbene la sorveglianza attiva dell’ordine dei sintomi distinguibili (cioè febbre, tosse, nausea / vomito e diarrea) possa essere utile a causa dei percorsi distintivi più e meno probabili che abbiamo determinato, abbiamo ampliato la nostra analisi ai sette sintomi comunemente osservati in tutti quattro malattie respiratorie studiate qui. Quindi, abbiamo creato una seconda serie di sintomi che corregge mal di gola, mialgia e mal di testa alla serie originale di sintomi ( Tabella supplementare 2 ). Le tre ulteriori sintomi sono più soggettivi ( 6 – 8). L’implementazione in sette sintomi del modello di progressione stocastica di COVID-19 mostra che questi sintomi aggiuntivi non hanno disturbato il nostro ordine iniziale di febbre, tosse, nausea / vomito e diarrea, ma hanno invece aggiunto un altro livello di complessità nel mezzo del probabile percorsi ( Figura 4). Troviamo ancora che il primo percorso più probabile passa alla febbre, indicando che la febbre è il primo sintomo più probabile. Da lì, il sintomo successivo più probabile è ancora una volta la tosse. Quindi, osserviamo una differenza non rilevabile nella probabilità di passare a mal di gola, mal di testa o mialgia, indicando che è probabile che tutti e tre si verifichino successivamente prima di procedere. Gli ultimi due nodi sono coerenti con l’ordine dei quattro sintomi, indicando che la nausea / vomito e poi la diarrea si verificano per ultimi. Sebbene questa implementazione sia più complessa perché ha sette sintomi, è coerente con i nostri risultati precedenti. Il percorso più probabile dei sintomi di COVID-19 è febbre, poi tosse e successivamente mal di gola, mialgia o mal di testa, seguiti da nausea / vomito e infine diarrea.N = 1.099) ( Figura 4 ) ( 16 ).
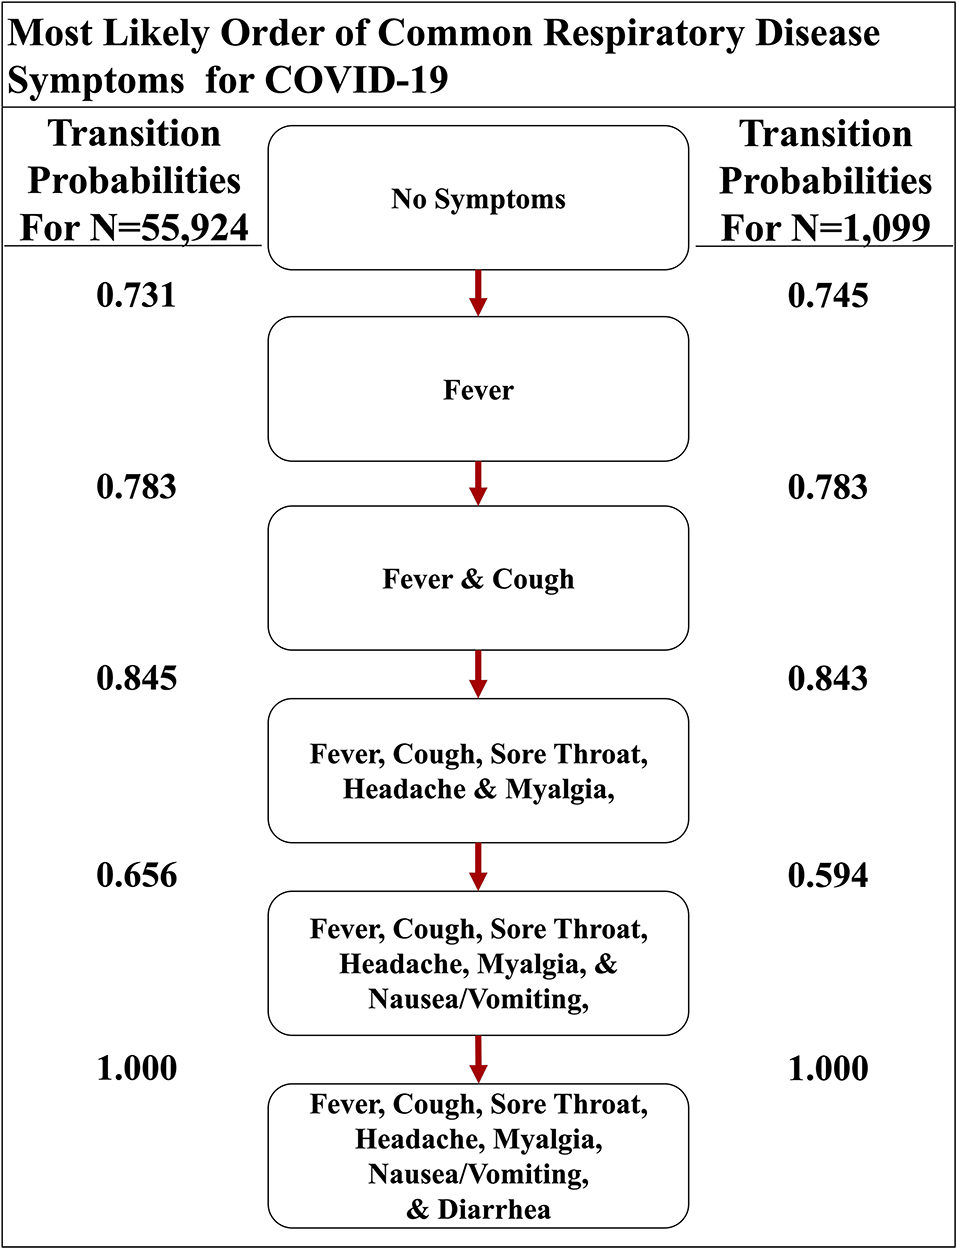 Figura 4 . Il percorso più probabile dei sintomi respiratori comuni in COVID-19. Il percorso più probabile di sette sintomi comuni di COVID-19, determinato dalle probabilità di transizione che sono anche elencate tra i nodi, di due set di dati qui.
Abbiamo anche implementato Stochastic progressione modello con le stesse sette sintomi in influenza, la SARS e MERS set di dati di confronto e la progressione della malattia contrasto con quello in COVID-19 ( Figura 5 ) ( 6 – 8 ). I risultati per l’influenza indicano che possono verificarsi prima tosse o mialgia ( Figura 5A ). Dopo che si verificano questi due sintomi, l’ordine dei sintomi è mal di testa, mal di gola e febbre. Infine, vomito / nausea e diarrea hanno una differenza non rilevabile nella probabilità che si verifichino per ultimi. L’implementazione MERS mostra un percorso più probabile in cui si verificherà prima la febbre, seguita da tosse, mal di testa e quindi mialgia ( Figura 5B). Questi sono seguiti da una differenza non rilevabile nella probabilità che si verifichino mal di testa e diarrea. Infine, mal di gola e nausea / vomito si verificheranno per ultimi con una differenza non rilevabile. L’implementazione per la SARS mostra che la febbre è più probabile che si verifichi per prima, seguita da una differenza non rilevabile nella probabilità di transizione di tosse e mialgia, che è simile alle altre malattie correlate al coronavirus ( Figura 5C ). Successivamente, è molto probabile il mal di testa. Infine, si verificano diarrea, mal di gola e nausea / vomito con una differenza di probabilità non rilevabile.
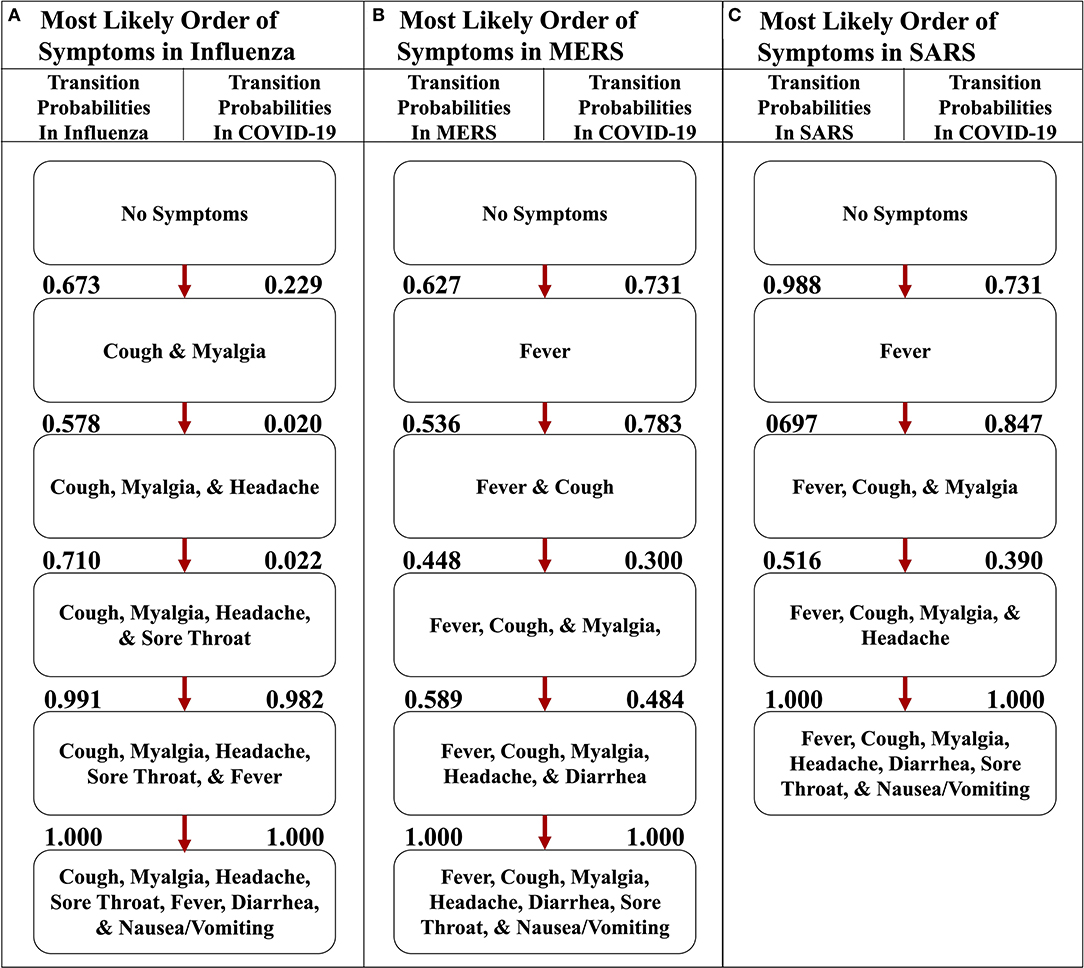 Figura 5 . I percorsi più probabili dei sintomi nell’influenza, MERS e SARS rispetto a COVID-19. (A) Il percorso più probabile di sette sintomi comuni dell’influenza con le probabilità di transizione elencate tra i nodi. (B) Il percorso più probabile di sette sintomi comuni di MERS con le probabilità di transizione elencate tra i nodi. (C) Il percorso più probabile di sette sintomi comuni della SARS con le probabilità di transizione elencate tra i nodi. Per ogni percorso, le probabilità di transizione in COVID-19 sono elencate a destra. I percorsi più probabili per ciascuna rispettiva malattia qui sono determinati dalle probabilità di transizione elencate tra i nodi a sinistra.
Per illustrare l’unicità del percorso più probabile di COVID-19, abbiamo trovato le probabilità di transizione dello stesso percorso nelle altre malattie respiratorie ( Figura 6 ). Confrontando e confrontando le probabilità, abbiamo scoperto che l’implementazione che rappresenta COVID-19 afferma fortemente che il primo sintomo sarà la febbre e la tosse seguirà presto perché le probabilità di transizione sono 0,731 e 0,783, rispettivamente ( Figura 6A ), mentre l’implementazione dell’influenza indica che la febbre è molto improbabile che si verifichi prima con una probabilità di solo 0,035 ( Figura 6B ). Inoltre, le implementazioni dei dati MERS e SARS hanno anche un’alta probabilità di passare prima alla febbre, con una probabilità rispettivamente di 0,627 e 0,988 ( Figure 6C, D). Il secondo sintomo del percorso più probabile del COVID-19 è la tosse, con una probabilità di 0,783, ma gli altri non hanno un’alta probabilità simile. Ad esempio, la malattia respiratoria con la più alta probabilità in quella transizione è MERS a 0,536. Tuttavia, dopo febbre e tosse, COVID-19 e le altre tre malattie respiratorie hanno una probabilità altrettanto alta dei tre sintomi soggettivi (cioè mal di gola, mal di testa e mialgia). Infine, il percorso più probabile di COVID-19 termina con nausea / vomito e poi diarrea. Queste osservazioni sono coerenti con i sintomi descritti dal CDC e supportano l’idea che la febbre seguita da tosse sembra altamente probabile che venga diagnosticata come COVID-19 ( 5 ).
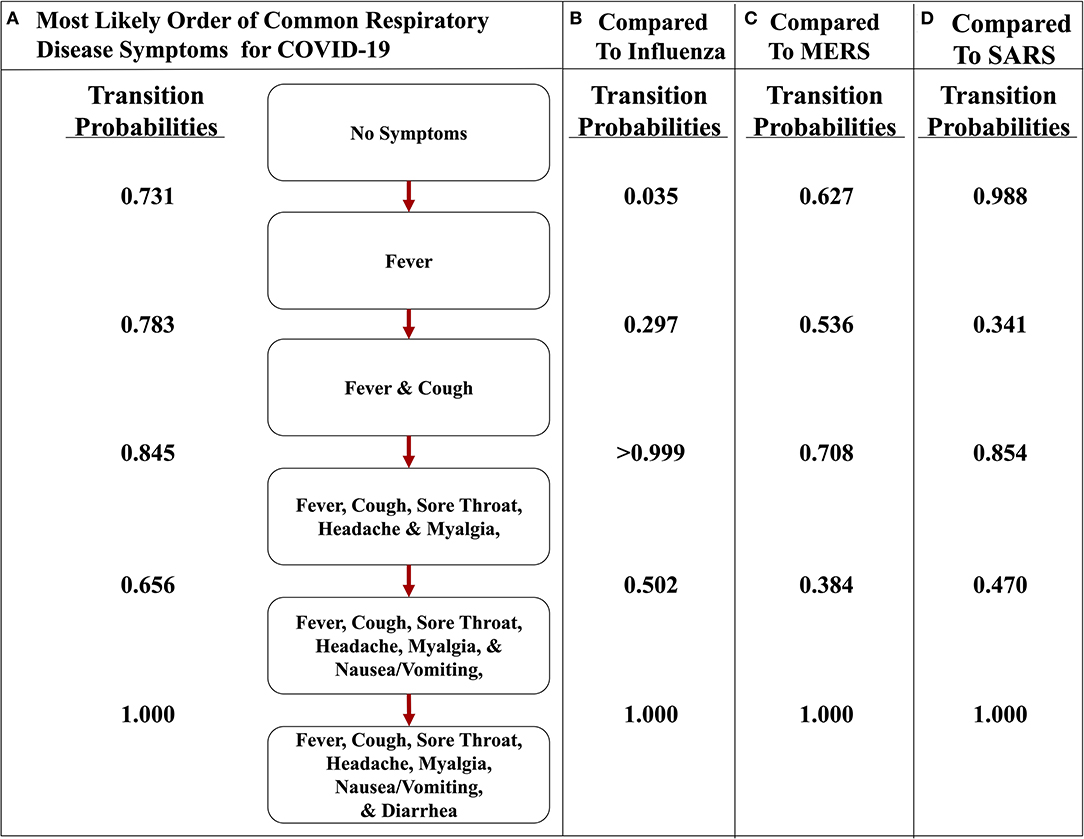 Figura 6 . Il percorso più probabile dei sintomi in COVID-19 rispetto a influenza, MERS e SARS. (A) Il percorso più probabile di sette sintomi comuni di COVID-19 con le probabilità di transizione elencate tra i nodi. (B) Le probabilità di transizione del percorso dell’influenza. (C) Le probabilità di transizione del percorso di MERS. (D) Le probabilità di transizione del percorso della SARS. Il percorso più probabile qui è determinato dalle probabilità di transizione elencate tra i nodi per COVID-19.
Inoltre, il confronto delle probabilità di transizione dei percorsi nella stessa malattia illustra il significato dei percorsi più probabili. Ad esempio, la probabilità di transizione più bassa nel percorso più probabile dell’influenza è 0,578 ( Figura 5A ), mentre quando si analizza l’influenza mentre attraversa il percorso più probabile del COVID-19, le probabilità di transizione osservate sono 0,5 o meno ( Figura 6B). Tuttavia, nello stesso percorso, la probabilità di transizione da febbre e tosse a febbre, tosse, mal di gola, mal di testa e mialgia è> 0,999. Questo valore mostra quanto sia improbabile che nausea / vomito e diarrea siano i sintomi iniziali dell’influenza. Inoltre, osservando il percorso più probabile di COVID-19, i primi due sintomi sembrano avere una forte probabilità di verificarsi nell’ordine di febbre e poi tosse, con una probabilità di 0,731 ( Figura 5A ). Tuttavia, la probabilità che la tosse si manifesti per prima in COVID-19 è 0,229, che è una probabilità bassa ( Figura 5A ). Questa osservazione supporta ulteriormente l’ipotesi che si verifichi prima la febbre e poi la tosse.
Richiamo e selettività quando si collega il primo sintomo e la malattia
Le implementazioni COVID-19 e influenzali del modello di progressione stocastica suggeriscono che c’è un’alta probabilità che si verifichino prima febbre e tosse, rispettivamente. Volevamo trovare metriche che quantificassero il possibile legame tra il primo sintomo e queste due malattie. Quindi, abbiamo determinato il richiamo e la selettività quando si utilizza il sintomo iniziale come indicatore di COVID-19 o influenza, con tutte le altre possibili malattie escluse in una popolazione di pazienti teorica. Innanzitutto, abbiamo simulato i set di dati dei pazienti utilizzando i dati riportati che erano indipendenti da tutto il lavoro precedente che abbiamo integrato nelle nostre analisi sopra ( Tabella supplementare 5 ) ( 20). Sono stati creati due set di dati dei pazienti simulati per analizzare separatamente COVID-19 e influenza per rappresentare il legame specifico di ciascuna malattia con il sintomo iniziale corrispondente che abbiamo determinato, rispettivamente febbre e tosse. I dati simulati contenevano informazioni sullo stato di malattia dei pazienti (COVID-19, influenza o meno) e sul loro primo sintomo sperimentato. Sulla base delle informazioni del solo primo sintomo, abbiamo classificato i dati del paziente simulato come infetti da COVID-19 o meno e influenza o meno. Il richiamo è stato calcolato come il numero di pazienti simulati che abbiamo correttamente identificato come affetti dalla malattia rispetto al numero di pazienti simulati che avevano veramente la malattia ( 27). La selettività è stata definita qui come il numero di pazienti simulati che abbiamo correttamente identificato come non affetti dalla malattia rispetto al numero di pazienti simulati che veramente non avevano la malattia ( 28 ). Per entrambe le malattie, abbiamo eseguito questa analisi per cinque campioni simulati di diverse dimensioni, ciascuno contenente il 5% di individui infetti. Abbiamo ripetuto questo processo 10 volte e calcolato la deviazione media e standard su ciascuna dimensione del campione sia per COVID-19 che per l’influenza ( Tabelle 1 , 2 ).
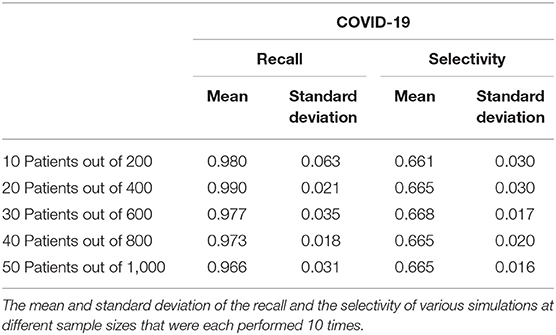 Tabella 1 . Richiamo e selettività di collegare la febbre come primo sintomo dei pazienti con COVID-19.
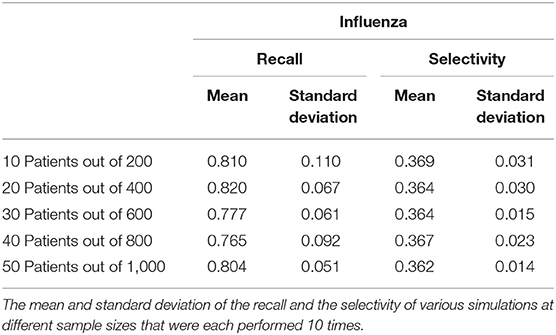 Tabella 2 . Richiamo e selettività del collegamento della tosse come primo sintomo dei pazienti con influenza.
Il richiamo varia da 0,966 a 0,990 con una deviazione standard di 0,031 e 0,021, rispettivamente quando si analizza il legame tra COVID-19 e febbre come primo sintomo. La deviazione standard massima di qualsiasi dimensione del campione è 0,063 per la media di 0,980. D’altra parte, la selettività della febbre come primo sintomo di COVID-19 varia da 0,661 a 0,668 con una deviazione standard di 0,030 e 0,020, rispettivamente, e 0,030 è la deviazione standard massima con medie corrispondenti di 0,661 e 0,665 ( Tabella 1). Per quanto riguarda la tosse come primo sintomo dell’influenza, il richiamo varia da 0,765 a 0,820 con corrispondenti deviazioni standard 0,092 e 0,067. La deviazione standard più alta è 0,110 con una media di 0,810 e la selettività varia da 0,362 a 0,369 con deviazioni standard di 0,014 e 0,031, rispettivamente, e la deviazione standard massima è 0,031 ( Tabella 2 ).
Il richiamo in entrambi i casi è inferiore alla selettività e questa osservazione indica che questa analisi classifica i pazienti come infetti quando non lo sono, ma il richiamo elevato indica che la maggior parte dei pazienti infetti si è allineata con il primo sintomo da noi previsto. In futuro, ci aspettiamo di confermare questa analisi con i dati sui primi sintomi, al contrario dei dati simulati, ma lo scopo di questa analisi era mostrare che un ulteriore studio dell’ordine dei sintomi potrebbe portare a un riconoscimento più precoce.
Discussione
In questo studio, abbiamo trovato prove che supportano l’idea che esiste un ordine più comune di sintomi distinguibili in COVID-19 che è anche diverso da altre importanti malattie respiratorie. Il sintomo iniziale più probabile è la febbre nelle tre malattie studiate che sono causate dai coronavirus (cioè, COVID-19, SARS e MERS) e la tosse nell’influenza. L’ordine più probabile dei quattro sintomi facilmente distinguibili è identico in MERS e SARS, ma il percorso più probabile di COVID-19 ha una differenza fondamentale. I primi due sintomi di COVID-19, SARS e MERS sono febbre e tosse. Tuttavia, il tratto gastrointestinale superiore (cioè nausea / vomito) sembra essere colpito prima del tratto gastrointestinale inferiore (cioè diarrea) in COVID-19, che è l’opposto di MERS e SARS. In tutte le malattie, abbiamo riscontrato che la febbre e la tosse si verificano prima di nausea / vomito e diarrea. Osservando la serie di sette sintomi, inclusi tre soggettivi (cioè mal di gola, mal di testa e mialgia), abbiamo scoperto che i sintomi iniziali del percorso più probabile sono gli stessi del percorso più probabile dei quattro sintomi distinguibili. Inoltre, in entrambe le implementazioni dei quattro e dei sette sintomi, i sintomi del tratto gastrointestinale sono gli ultimi. Un set di dati MERS separato includeva i sintomi iniziali dei pazienti al ricovero, che elencava i sintomi dalla probabilità più alta a quella più bassa come febbre, mialgia, tosse e diarrea (18 ). Questo ordine è simile al percorso più probabile che abbiamo determinato. Una percentuale molto piccola dei pazienti ha sperimentato la diarrea come sintomo iniziale. Questo rapporto suggerisce che la diarrea come sintomo precoce indica una malattia più aggressiva, perché ogni paziente in questo set di dati che inizialmente ha manifestato diarrea ha avuto alla fine polmonite o insufficienza respiratoria ( Tabella supplementare 3 ). Proponiamo che questi pazienti stiano sperimentando una forma più aggressiva della malattia e abbiano accelerato il percorso più probabile, avendo già sperimentato la diarrea. Questi risultati sono in linea con un altro set di dati fornito per la SARS, che conteneva anche la percentuale dei vari sintomi da segnalare per primi ( Tabella supplementare 4). Il sintomo più alto riportato è la febbre, seguita da tosse o dispnea e, infine, una piccola percentuale dei pazienti ha riportato diarrea ( 19 ). Questo ordine conferma i percorsi più probabili che abbiamo determinato. L’osservazione che la diarrea era molto rara come primo sintomo e aveva una probabilità di insorgenza diversa da zero è coerente con la nostra analisi. Ciò è in linea con la nostra ipotesi secondo cui la comparsa precoce di diarrea implica che quei pazienti possano avere una forma molto più aggressiva della malattia.
I dati di simulazione utilizzati per approssimare le probabilità di stato e di transizione nel modello di progressione stocastica si basano sul presupposto che i sintomi inclusi nel modello siano indipendenti. Usando la definizione di indipendenza, abbiamo osservato le probabilità individuali di febbre e tosse in un set di dati da un caso di studio di influenza e abbiamo scoperto che il prodotto delle probabilità individuali di febbre e tosse è quasi uguale alla probabilità che si verifichino entrambe ( 21). Considerando questo risultato, abbiamo proceduto nell’ipotesi di indipendenza, che rivaluteremo quando saranno disponibili più dati sui sintomi. Abbiamo simulato combinazioni di sintomi per 500.000 pazienti, che abbiamo scelto perché era il numero più basso tentato che produceva empiricamente il risultato teorico atteso per i sintomi di frequenza casuale: che tutti i percorsi sarebbero stati ugualmente probabili, fino a centesimi di cifra decimale. Abbiamo quindi utilizzato questi pazienti simulati per approssimare le probabilità di stato e le probabilità di transizione descritte sopra.
Questo studio supporta l’idea che i sintomi si manifestino in un ordine prevedibile, ma è necessario un lavoro futuro per migliorare gli aspetti del modello di progressione stocastica e confermare i risultati qui trovati. La nostra scoperta che COVID-19 si presenta per la prima volta con la febbre supporta le misure raccomandate dal CDC che affermano che il pubblico dovrebbe misurare la temperatura a casa e quando entra nelle strutture come metodo di controllo precoce ( 29). Questa applicazione del modello di progressione stocastica può essere migliorata se ci fossero modi oggettivi per misurare i sintomi più soggettivi (cioè, mal di gola, mal di testa e mialgia). Inoltre, migliori calcoli di errore delle probabilità di transizione porterebbero a risultati più accurati. Nostro calcolo di errore di corrente è conservatore, perché quando sono stati aggiunti più sintomi, abbiamo osservato che l’errore aggravato andando avanti più in basso i percorsi ( Supplemento figure 2 – 13). La stima conservativa dell’errore crea problemi nel discernere la differenza nelle probabilità dei sintomi. Nello specifico, nell’implementazione di sette sintomi, le probabilità sono più difficili da accertare a causa della segnalazione soggettiva e dei calcoli dell’errore di composizione. I set di dati che contengono l’ordine dei sintomi per ogni paziente ridurrebbero l’errore. Inoltre, questi tipi di set di dati migliorerebbero le approssimazioni delle probabilità di transizione e aumenterebbero la precisione. Questo miglioramento potrebbe essere ottenuto dai medici che implementano la pratica della registrazione dell’ordine di comparsa dei sintomi. Con queste informazioni, possiamo approssimare la probabilità che un paziente acquisisca un sintomo in base ai suoi sintomi attuali con i dati del paziente invece di simulazioni basate sulla frequenza. Applicare criteri oggettivi per i sintomi, migliorare i calcoli degli errori e raccogliere l’ordine dei sintomi non solo ci consentirebbe di migliorare i nostri risultati qui, ma consentirebbe anche al modello di progressione stocastica di prevedere gli ordini di un insieme più ampio di sintomi. La forma ottimale del modello di progressione stocastica sarebbe sviluppata determinando le probabilità di stato dalle frequenze reali osservate dei sintomi dei pazienti e determinando le probabilità di transizione dal vero ordine dei sintomi dei pazienti. Tuttavia, fino a quando questi dati non saranno disponibili, saranno necessarie approssimazioni, simulazioni e calcoli degli errori migliori. La forma ottimale del modello di progressione stocastica sarebbe sviluppata determinando le probabilità di stato dalle frequenze reali osservate dei sintomi dei pazienti e determinando le probabilità di transizione dal vero ordine dei sintomi dei pazienti. Tuttavia, fino a quando questi dati non saranno disponibili, saranno necessarie approssimazioni, simulazioni e calcoli degli errori migliori. La forma ottimale del modello di progressione stocastica sarebbe sviluppata determinando le probabilità di stato dalle frequenze reali osservate dei sintomi dei pazienti e determinando le probabilità di transizione dal vero ordine dei sintomi dei pazienti. Tuttavia, fino a quando questi dati non saranno disponibili, saranno necessarie approssimazioni, simulazioni e calcoli degli errori migliori.
Inoltre, quando si analizza la febbre come primo sintomo di COVID-19, una bassa selettività indica un alto errore di Tipo I (cioè, tasso di falsi positivi) e un alto richiamo indica un basso errore di Tipo II (cioè, tasso di falsi negativi) . Abbiamo trovato un valore di selettività moderato e, di conseguenza, un errore di tipo I. moderato in questo caso. Questo errore di tipo I è accettabile nel nostro uso di investigazione sulla febbre come sintomo iniziale di COVID-19, perché suggerisce che vengono testate più persone che non sono infette, piuttosto che meno persone vengono testate che sono infette, come con l’errore di tipo II ( 30). Non proponiamo il sintomo iniziale come test diagnostico, ma come possibile segno per sottoporsi al test. I focolai di COVID-19 in gruppi e questi insoliti gruppi di malattie sono caratteristici di una malattia pandemica che deve essere affrontata immediatamente con test aggressivi per frenare la trasmissione ( 31 ).
L’importanza di conoscere i primi sintomi è radicata nella necessità di fermare la diffusione del COVID-19, una malattia che è da due a tre volte più trasmissibile dell’influenza e si traduce in focolai di gruppi ( 3 , 4). Esiste un rischio maggiore di trasmissione di COVID-19, quindi test più rapidi e distanziamento sociale sono importanti, soprattutto quando le misure di distanziamento sociale e quarantena sono allentate. I nostri risultati affermano che la febbre è il sintomo più probabile che si manifesti per primo nei pazienti adulti sintomatici con COVID-19. Ci auguriamo che le ipotesi generate in questo lavoro siano testate con dati clinici prospettici per confermare che la tosse si verifica prima più spesso nell’influenza e allo stesso modo la febbre nel COVID-19. Riteniamo che i rilevatori precoci che qualsiasi individuo possa riconoscere per richiedere assistenza medica prima siano utili. Inoltre, i set di dati che contengono informazioni sull’ordine dei sintomi e sui ceppi di COVID-19 consentono ulteriori studi che possono determinare se l’insorgenza dei sintomi varia in ceppi specifici ( 32) e se fattori di rischio, come l’obesità ( 33 ), e fattori ambientali, come la temperatura ( 34 ), influenzano l’ordine dei sintomi. Per rallentare la diffusione del COVID-19, i nostri risultati supportano la pratica secondo cui la febbre dovrebbe essere testata prima di consentire l’ingresso alle strutture e che le persone con febbre dovrebbero immediatamente consultare un medico per la diagnosi e la ricerca dei contatti. Tali misure possono aiutare a ridurre la trasmissione nonostante l’elevato contagio di SARS-CoV-2.
Dichiarazione sulla disponibilità dei dati
I set di dati disponibili pubblicamente sono stati analizzati per questo studio. Questi possono essere trovati qui: https://www.who.int/publications-detail/report-of-the-who-china-joint-mission-on-coronavirus- disease-2019- (covid-19) , https: //www.nejm.org/doi/full/10.1056/NEJMoa2002032 , https://jamanetwork.com/journals/jamainternalmedicine/fullarticle/485554 , https://onlinelibrary.wiley.com/doi/full/10.1111/resp. 13196 , https://www.journalofinfection.com/article/S0163-44531630209-2/abstract , https://jamanetwork.com/journals/jama/fullarticle/196681 , https://jamanetwork.com/journals/jama/ fullarticle / 2761044 ,https://www.cambridge.org/core/journals/infection-control-and-hospital-epidemio logy / article / sintomi-di-infezione-virus-influenzale-in-pazienti-ospedalizzati / 8F1B478BA4B861D356393EA77AD8B83B # .
Contributi dell’autore
JL e JH hanno ideato il modello. JL e JM hanno ideato il progetto. JL ha creato il modello. JL, MM e JM hanno analizzato i risultati. JL e MM hanno scritto il manoscritto. PK e JH hanno supervisionato il progetto. Tutti gli autori hanno letto, modificato e approvato il manoscritto finale.
Finanziamento
Questo lavoro è stato sostenuto dal National Cancer Institute (premio numero U54CA143906 e P30CA014089) e dalla borsa di studio Carol Vassiliadis. JL è stato sostenuto dall’USC Dana e dal David Dornsife College of Letters, Arts and Sciences e dalla Schlegel Family Endowment Fellowship.
Conflitto d’interesse
MM è impiegato dalla società Nexus Development PA LLC. JM è un dipendente della società NanoCarrier Co., Ltd.
I restanti autori dichiarano che la ricerca è stata condotta in assenza di rapporti commerciali o finanziari che potrebbero essere interpretati come un potenziale conflitto di interessi.
Ringraziamenti
Desideriamo ringraziare il Dr. Jorge Nieva per le discussioni e i consigli e Libere Ndacayisaba per la lettura critica del manoscritto.
Materiale supplementare
Il materiale supplementare per questo articolo può essere trovato online su: https://www.frontiersin.org/articles/10.3389/fpubh.2020.00473/full#supplementary-material
Riferimenti
1. Dong E, Du H, Gardner L. Un dashboard interattivo basato sul Web per monitorare COVID-19 in tempo reale. Lancet Infectious Dis. (2020) 20: 533–4. doi: 10.1016 / S1473-3099 (20) 30120-1
2. Cascella M, Rajnik M, Cuomo A, Dulebohn SC, Di Napoli R. Features, Evaluation and Treatment Coronavirus (COVID-19) . StatPearls Publishing (2020).
3. Anderson RM, Heesterbeek H, Klinkenberg D, Hollingsworth TD. In che modo le misure di mitigazione basate sul paese influenzeranno il corso dell’epidemia di COVID-19? Lancetta. (2020) 395: 931–4. doi: 10.1016 / S0140-6736 (20) 30567-5
4. Sun K, Chen J, Viboud C. Analisi epidemiologica iniziale dell’epidemia di coronavirus 2019 basata su dati crowdsourcing: uno studio osservazionale a livello di popolazione. Lancet Digital Health. (2020) 2: E201–8. doi: 10.1016 / S2589-7500 (20) 30026-1
5. Sohrabi C, Alsafi Z, O’Neill N, Khan M, Kerwan A, Al-Jabir A, et al. L’Organizzazione Mondiale della Sanità dichiara l’emergenza globale: una revisione del nuovo coronavirus del 2019 (COVID-19). Int J Surg. (2020) 76: 71–6. doi: 10.1016 / j.ijsu.2020.02.034
6. Monto AS, Gravenstein S, Elliott M, Colopy M, Schweinle J. Segni e sintomi clinici predittivi dell’infezione influenzale. Archiv Internal Med. (2000) 160: 3243–7. doi: 10.1001 / archinte.160.21.3243
7. Yin Y, Wunderink RG. MERS, SARS e altri coronavirus come cause di polmonite. Respirologia. (2018) 23: 130–7. doi: 10.1111 / risp.13196
8. Organizzazione WH Organizzazione WH. Report of the WHO-China Joint Mission on Coronavirus Disease 2019 (Covid-19) . (2020). Disponibile online su: https://www.who.int/docs/default-source/coronaviruse/who-china-joint-mission-on-covid-19-final-report.pdf (visitato il 12 aprile 2020).
9. Reed C, Kim IK, Singleton JA, Chaves SS, Flannery B, Finelli L, et al. Stima delle malattie influenzali e dei ricoveri scongiurati dalla vaccinazione – Stati Uniti, stagione influenzale 2013-14. Rapporto settimanale sulla mortalità per morbilità MMWR. (2014) 63: 1151–4.
10. Newton PK, Mason J, Bethel K, Bazhenova LA, Nieva J, Kuhn P. Un modello stocastico a catena di Markov per descrivere la crescita e le metastasi del cancro del polmone. PLoS ONE. (2012) 7: 34367. doi: 10.1371 / journal.pone.0034637
11. Newton PK, Mason J, Bethel K, Bazhenova L, Nieva J, Norton L, et al. Diffusori e spugne definiscono le metastasi nel cancro del polmone: un modello matematico Monte Carlo a catena di Markov. Cancer Res. (2013) 73: 2760–9. doi: 10.1158 / 0008-5472.CAN-12-4488
12. Bazhenova L, Newton P, Mason J, Bethel K, Nieva J, Kuhn P. Metastasi surrenali nel cancro del polmone: implicazioni cliniche di un modello matematico. J Thoracic Oncol. (2014) 9: 442–6. doi: 10.1097 / JTO.0000000000000133
13. Newton PK, Mason J, Hurt B, Bethel K, Bazhenova L, Nieva J, et al. Entropia, complessità e diagrammi di Markov per modelli di cancro a camminata casuale. Sci Rep. (2014) 4: 7558. doi: 10.1038 / srep07558
14. Newton PK, Mason J, Venkatappa N, Jochelson MS, Hurt B, Nieva J, et al. Progressione spazio-temporale del carcinoma mammario metastatico: un modello a catena di Markov che evidenzia il ruolo dei primi siti metastatici. Cancro al seno NPJ. (2015) 1: 1–9. doi: 10.1038 / npjbcancer.2015.18
15. Catene Eriksson K, Jonsson M, Sjöstrand J. Markov su posets graduati. Ordine. (2018) 35: 93–109. doi: 10.1007 / s11083-016-9420-1
16. Guan WJ, Ni ZY, Hu Y, Liang WH, Ou CQ, He JX, et al. Caratteristiche cliniche della malattia da coronavirus 2019 in Cina. N Engl J Med . (2020) 382: 1708-20. doi: 10.1056 / NEJMoa2002032
17. Chan MC, Lee N, Chan PK, To K, Wong RY, Ho WS, et al. Virus dell’influenza stagionale A nelle feci di adulti ospedalizzati. Emerg infettiva Dis. (2011) 17: 2038. doi: 10.3201 / eid1711.110205
18. Ko JH, Park GE, Lee JY, Lee JY, Cho SY, Ha YE, et al. Fattori predittivi per lo sviluppo di polmonite e la progressione verso l’insufficienza respiratoria nei pazienti infetti da MERS-CoV. Infezione da J. (2016) 73: 468–75. doi: 10.1016 / j.jinf.2016.08.005
19. Cabina CM, Matukas LM, Tomlinson GA, Rachlis AR, Rose DB, Dwosh HA, et al. Caratteristiche cliniche e risultati a breve termine di 144 pazienti con SARS nell’area metropolitana di Toronto. JAMA. (2003) 289: 2801–9. doi: 10.1001 / jama.289.21.JOC30885
20. Wang D, Hu B, Hu C, Zhu F, Liu X, Zhang J, et al. Caratteristiche cliniche di 138 pazienti ospedalizzati con nuova polmonite infetta da coronavirus del 2019 a Wuhan, in Cina. JAMA. (2020) 323: 1061–9. doi: 10.1001 / jama.2020.1585
21. Van den Dool C, Hak E, Wallinga J, Van Loon A, Lammers J, Bonten M. Sintomi di infezione da virus influenzale in pazienti ospedalizzati. Epidemiol ospedaliero per il controllo delle infezioni. (2008) 29: 314–9. doi: 10.1086 / 529211
22. Ciomek K. hasseDiagram: Drawing Hasse Diagram . (2017). Disponibile online su: https://CRAN.R-project.org/package=hasseDiagram (visitato il 9 aprile 2020).
23. Team RC. R: Un linguaggio e un ambiente per il calcolo statistico . R Foundation for Statistical Computing. (2018). Disponibile online su: https://www.R-project.org/ (visitato il 13 febbraio 2019).
24. Varga Z, Flammer AJ, Steiger P, Haberecker M, Andermatt R, Zinkernagel AS, et al. Infezione delle cellule endoteliali ed endoteliite in COVID-19. Lancetta. (2020) 395: 1417–8. doi: 10.1016 / S0140-6736 (20) 30937-5
25. Wu Y, Xu X, Chen Z, Duan J, Hashimoto K, Yang L, et al. Coinvolgimento del sistema nervoso dopo l’infezione da COVID-19 e altri coronavirus. Immunità al comportamento cerebrale. (2020) 87: 18-22. doi: 10.1016 / j.bbi.2020.03.031
26. Diaz-Guimaraens B, Dominguez-Santas M, Suarez-Valle A, Pindado-Ortega C, Selda-Enriquez G, Bea-Ardebol S, et al. Eruzione cutanea petecchiale associata a grave infezione da coronavirus 2 della sindrome respiratoria acuta. JAMA Dermatol. (2020) 156: 820–2. doi: 10.1001 / jamadermatol.2020.1741
27. Poteri DMW. Valutazione: da precisione, richiamo e misura a ROC, informazione, marcatura e correlazione. J Mach Learn Technol . 2: 37–63.
28. Lozano J, Santos J, Horrillo M. Classificazione degli aromi del vino bianco con un naso elettronico. Talanta. (2005) 67: 610–6. doi: 10.1016 / j.talanta.2005.03.015
29. Ng Y, Li Z, Chua YX, Chaw WL, Zhao Z, Er B, et al. Valutazione dell’efficacia delle misure di sorveglianza e contenimento per i primi 100 pazienti con COVID-19 a Singapore – 2 gennaio – 29 febbraio 2020. Centers Dis Control Prev . (2020) 69: 307–11. doi: 10.15585 / mmwr.mm6911e1
30. Pericchi L, Pereira C. Livelli di significatività adattativa utilizzando regole di decisione ottimali: bilanciamento ponderando le probabilità di errore. Statista Brasile J Probabil. (2016) 30: 70–90. doi: 10.1214 / 14-BJPS257
31. Hitchcock P, Chamberlain A, Van Wagoner M, Inglesby TV, O’Toole T. Sfide alla sorveglianza globale e alla risposta a focolai di malattie infettive di importanza internazionale. Biosicurezza Bioterrorismo. (2007) 5: 206–27. doi: 10.1089 / bsp.2007.0041
32. Tang X, Wu C, Li X, Song Y, Yao X, Wu X, et al. Sull’origine e la continua evoluzione della SARS-CoV-2. Natl Sci Rev. (2020) 7: nwaa036. doi: 10.1093 / nsr / nwaa036
33. Accendino J, Phillips M, Hochman S, Sterling S, Johnson D, Francois F, et al. L’obesità nei pazienti di età inferiore ai 60 anni è un fattore di rischio per il ricovero ospedaliero Covid-19. Clin Infect Dis. (2020) 71: ciaa415. doi: 10.1093 / cid / ciaa415
Parole chiave: COVID-19, Markov, probabilità, sintomi, stocastico, modello, malattia, influenza
Citazione: Larsen JR, Martin MR, Martin JD, Kuhn P e Hicks JB (2020) Modeling the Onset of Symptoms of COVID-19. Davanti. Salute pubblica 8: 473. doi: 10.3389 / fpubh.2020.00473
Ricevuto: 13 aprile 2020; Accettato: 27 luglio 2020;
Pubblicato: 13 agosto 2020.
Modificato da:
Alexander Rodriguez-Palacios , Dipartimento di Medicina, Case Western Reserve University, Stati Uniti
Recensito da:
Herve Seligmann , The Hebrew University of Jerusalem, Israel
Tauqeer Hussain Mallhi , Department of Clinical Pharmacy, College of Pharmacy, Al Jouf University, Arabia Saudita
Copyright © 2020 Larsen, Martin, Martin, Kuhn e Hicks. Questo è un articolo ad accesso aperto distribuito secondo i termini della Creative Commons Attribution License (CC BY) . L’utilizzo, la distribuzione o la riproduzione in altri forum sono consentiti, a condizione che gli autori originali e i proprietari del copyright siano accreditati e che la pubblicazione originale in questa rivista sia citata, in conformità con la pratica accademica accettata. Non è consentito l’uso, la distribuzione o la riproduzione che non sia conforme a questi termini.
* Corrispondenza: Peter Kuhn, pkuhn@usc.edu ; James B. Hicks, jameshic@usc.edu
Fonte frontiersin.org
l’articolo in lingua inglese
COVID-19 is a pandemic viral disease with catastrophic global impact. This disease is more contagious than influenza such that cluster outbreaks occur frequently. If patients with symptoms quickly underwent testing and contact tracing, these outbreaks could be contained. Unfortunately, COVID-19 patients have symptoms similar to other common illnesses. Here, we hypothesize the order of symptom occurrence could help patients and medical professionals more quickly distinguish COVID-19 from other respiratory diseases, yet such essential information is largely unavailable. To this end, we apply a Markov Process to a graded partially ordered set based on clinical observations of COVID-19 cases to ascertain the most likely order of discernible symptoms (i.e., fever, cough, nausea/vomiting, and diarrhea) in COVID-19 patients. We then compared the progression of these symptoms in COVID-19 to other respiratory diseases, such as influenza, SARS, and MERS, to observe if the diseases present differently. Our model predicts that influenza initiates with cough, whereas COVID-19 like other coronavirus-related diseases initiates with fever. However, COVID-19 differs from SARS and MERS in the order of gastrointestinal symptoms. Our results support the notion that fever should be used to screen for entry into facilities as regions begin to reopen after the outbreak of Spring 2020. Additionally, our findings suggest that good clinical practice should involve recording the order of symptom occurrence in COVID-19 and other diseases. If such a systemic clinical practice had been standard since ancient diseases, perhaps the transition from local outbreak to pandemic could have been avoided.
Introduction
The current pandemic of Coronavirus Disease 2019 (COVID-19), caused by severe acute respiratory syndrome coronavirus 2 (SARS-CoV-2), has undergone an observed exponential increase of cases that has overrun hospitals across the world (1). Many people have mild forms of the disease and are advised not to go to the hospital or to seek a diagnostic test because they can recover at home. A large number of others are asymptomatic (2). Infected individuals are highly contagious and can transmit the disease even if they are asymptomatic, and this fact furthers the need to isolate and test often (2). In addition, COVID-19 is two to three times more contagious than influenza (3). Due to these characteristics, outbreaks of COVID-19 occur in clusters (4). Identifying COVID-19 early could reduce the number and size of clusters, but early symptoms are not well-defined. The Center for Disease Control and Prevention (CDC) in the USA and the World Health Organization (WHO) currently advise the public to call their doctor if they believe they have been exposed to COVID-19 or exhibit fever and cough (5). However, fever and cough are associated with other respiratory diseases such as influenza (6–8). Influenza, with an estimated number of symptomatic cases in the millions annually in the U.S. alone (9), also is commonly associated with fever and cough (6). Similarly to COVID-19, the Middle East Respiratory Syndrome (MERS) and the Severe Acute Respiratory Syndrome (SARS) are respiratory illnesses contracted from coronaviruses called the MERS-Related Coronavirus (MERS-CoV) and SARS-Related Coronavirus (SARS-CoV), respectively (7). The symptoms of these diseases also overlap with COVID-19. The capacity to discern differences in these common symptoms, such as order of occurrence and likely first symptoms, would aid in early recognition. If health care workers recorded and published clinically-observed and/or patient-reported sequences of symptoms, the reported data could be evaluated as an additional tool for early recognition of COVID-19 to increase self-surveillance and reduce spread. If such a widespread clinical practice had been instituted in the past, perhaps local outbreaks of influenzas, coronaviruses, and other diseases might have been contained before becoming pandemics.
To this end, we assumed that symptoms and their orders are independent variables and created a model that approximates the probability of symptoms occurring in specific orders using available, non-ordered patient data. The use of these assumptions and data was necessary given the lack of ordered data. To do this, we applied a Markov Process to determine the order of occurrence of common symptoms of respiratory diseases. We have previously used a Markov Chain to predict cancer metastasis location (10–14). A Markov Process is defined as a stochastic sequence of events in which the likelihood of the next state only depends on the current state rather than past or future states (15). In this case, we defined each state to be the specific symptoms that a patient has experienced, and each transition is only dependent on these symptoms. As a result, we can determine the likelihood of each symptom stepwise using a Markov Process. We defined the state probability of a node as the frequency that a patient has a particular combination of symptoms divided by the total number of patients that exhibit the same number of symptoms. The transition probability between two states is defined as the likelihood of acquiring a single specific symptom divided by the likelihood of acquiring all possible next symptoms. We then applied a greedy algorithmic approach using the transition probabilities to calculate the probability of all possible orders toward determining the most and least likely orders of symptoms.
In this study, we first defined this specific application of a Markov Process applied to a graded partially ordered set (poset), which we refer to as the Stochastic Progression Model. In this case, our graded poset represents all possible combinations of symptoms and all possible orders of symptom occurrence. It is graded because the possible combinations of symptoms are ranked by the number of symptoms that they each represent. For example, the symptom combination of fever and cough has the same rank as the combination of cough and diarrhea. We found that the Stochastic Progression Model for adults that are symptomatic indicates that there may be an order of discernible symptoms in COVID-19, but the order of symptoms seems to be independent of severity of the case on admission. From there, we compared the most likely order of symptoms in other respiratory diseases to COVID-19. To expand on our results, we analyzed a larger set of symptoms that are common to all respiratory diseases studied here and sought to decipher further distinctions.
Materials and Methods
Data Collection
Patient data from this study was collected from various reports in literature on the frequencies of symptoms in COVID-19, influenza, MERS, and SARS (Supplemental Tables 1, 2). Each dataset was used either to approximate order of symptoms, to confirm our results, or to analyze first symptoms in COVID-19 or influenza. For all of these applications, we used the reported patient data to simulate patients with various combinations of symptoms experienced and then applied the simulated data to perform the analyses.
The main dataset of COVID-19 patients of the World Health Organization, containing 55,924 confirmed cases, was obtained through review of national and local governmental reports and observations made during visits to areas with infected individuals in China that occurred from February 16 to 24, 2020 (8). A confirmation dataset of COVID-19 patients, containing 1,099 confirmed cases, was obtained by the China Medical Treatment Expert Group for COVID-19 from medical records and other compiled data of hospitalized patients and outpatients that were diagnosed with COVID-19. This data was reported to the National Health Commission of China from December 11, 2019 to January 29, 2020 (16). For both COVID-19 datasets, myalgia was reported as myalgia or arthralgia. We assumed that most patients with myalgia also had arthralgia, and therefore we used the frequency of myalgia or arthralgia as a frequency for myalgia when simulating data. The influenza dataset, containing 2,470 confirmed cases, was collected by researchers at the University of Michigan from a retrospective pooled analysis of mostly unvaccinated patients participating in phase 2 and 3 clinical trials that were conducted in North America, Europe, and the Southern Hemisphere from 1994 to 1998 (6). This group of patients has a mean age of 35 and each exhibited multiple symptoms. Vomiting and diarrhea were not reported in this influenza dataset, but they are common among respiratory disease. Although adult patients at times may experience vomiting and diarrhea when infected with influenza, these symptoms are rare (17). Therefore, we approximate the frequency of these symptoms as 0.010 in this case. The datasets representing symptom frequency in MERS, containing 245 patients, and SARS, containing 357 patients, were collected on admission and were reported as clinical data from physicians, Dr. Yin, at the Beijing Chao-Yang Hospital and Dr. Wunderink, at the Northwestern University Feinberg School of Medicine (7). The patients included in these datasets varied in age and pre-existing conditions. In the cases of SARS, the patients tended to be younger and have fewer pre-existing conditions than in the cases of MERS.
We used initial frequency data of MERS and SARS to further ascertain early symptoms of disease. The MERS initial symptom frequency dataset, containing 45 confirmed cases, was collected from electronic medical records at the Samsung Medical Center in Seoul, South Korea that contained onset symptom data about patients in the 2015 Korean MERS outbreak (Supplemental Table 3) (18). The SARS initial symptom frequency dataset, containing 144 confirmed cases, was collected from hospital records including information of early symptoms in patients dating from March 7 to April 10, 2003 during an outbreak in the greater Toronto area (Supplemental Table 4) (19).
Lastly, two additional datasets were collected to determine the utility of using first symptoms as early indicators of COVID-19 and influenza. The COVID-19 dataset used, containing 138 patients, was independent of all prior COVID-19 datasets. This data was obtained from electronic medical records of patients admitted to the Zhongnan Hospital of Wuhan University from January 1 to 28, 2020 (20). The symptom data was collected at onset of disease and all patients experienced pneumonia due to COVID-19. In this dataset, nausea and vomiting were reported separately for COVID-19. We assumed that most patients who experience vomiting, which is reported with a frequency of 0.036, also experience nausea, which is reported with a frequency of 0.101, and therefore to simulate the data, we defined the frequency for nausea/vomiting as 0.101. The influenza dataset used reported 20 confirmed cases of influenza and 400 confirmed negative cases of influenza and is independent from any other influenza dataset we used (21). The symptom data was collected through questionnaires and observations by medical professionals during the influenza seasons of 2006 and 2007 of infected patients admitted at the Department of Internal Medicine and Infectious Diseases and the Department of Pulmonology at the University Medical Center Utrecht. Like the other influenza dataset described above, vomiting and diarrhea were not reported in this dataset. So, we once again assumed the frequency of these symptoms to be 0.010 (17). Because this study was conducted in 2006 and 2007, prior to the COVID-19 outbreak, we assumed these patients were negative for COVID-19 as well. So, this 400-patient group was used as the dataset that represents individuals negative for both COVID-19 and influenza (Supplemental Table 5).
Simulating Symptom Progression From Patient Data
The Stochastic Progression Model was built in R under version 3.5.2 and was illustrated by using the hasse function in the hasseDiagram_0.1.3 library (code available online: https://github.com/j-larsen/Stochastic_Progression_of_COVID-19_Symptoms) (22, 23). Each respiratory disease report was represented by a corresponding data frame, with columns as symptoms, one row as the frequency of the symptoms observed in the study, and the other row as the frequency multiplied by 1,000. The multiple of the frequency is defined as the frequency count, which represents the probability of a symptom in a theoretical sample size of 1,000 simulated patients. Additionally, the state of an individual is displayed through a character array of ones and zeros, where ones represent the presence of a symptom and zeroes represent its absence. This process of simulating a symptom is analogous to a jar of marbles of either two colors. The probability of pulling one color of marble (i.e., a specific symptom) is illustrated by the frequency count because the total number of marbles in the jar is 1,000 and the frequency count for each is the number of the specific color of marbles in the jar.
We then simulated data of 500,000 patients, by randomly selecting if a patient has or does not have a symptom using the procedure described above and storing that information in a data frame that represents patients as rows and symptoms as columns. We assumed the occurrence of symptoms are random and independent. Considering these assumptions, we built the character arrays by applying the jar of marbles method for each simulated patient. The method repeats for each patient and involves pulling a marble from a series of jars representing each symptom. The information from each randomly pulled marble is stored in the corresponding cell of the character array in the correct column representing the symptom and the row representing the simulated patient. This process is repeated for all 500,000 simulated patients for all symptoms.
Building the Stochastic Progression Model
The Stochastic Progression Model is illustrated as a directed acyclic graph with nodes, representing the power set of Boolean vectors. The power sets of Boolean vectors each represent a possible state of a patient by noting the absence or presence of specific symptoms. The edges, which illustrate the transition from one state to another, were selected specifically using key definitions and assumptions to create a poset. We defined the states at the nodes as symptoms that a patient has experienced up until this point. We created and directed edges from states with fewer symptoms to more starting at the minimum set of a Boolean vector of all zeros, which indicates a person with no symptoms. First, we assume that each symptom occurs one at a time, even if the difference in time is infinitesimal. With this assumption, a node can only be directed to other nodes that denote the same set of symptoms plus one additional symptom. Second, we assume that if a patient does not digress and does not die, they will eventually acquire all symptoms reaching the maximum set of a Boolean vector, which represents a patient that has exhibited all symptoms. Applying these assumptions to form the directed acyclic graph creates a Hasse Diagram of a graded poset that follows a Markov Process altogether comprising the Stochastic Progression Model.
Calculating State and Transition Probabilities
The nodes in the Hasse Diagram represent states of a patient by indicating the specific symptoms exhibited, and the edges represent transitions between these states. Therefore, we next needed to apply state probabilities to each node and transition probabilities to the directed edges. First, we labeled each simulated patient by summing the respective Boolean vector to find the number of symptoms for each patient. Then, to get the state probability of each node, we divided the number of simulated patients that are represented by the current Boolean vector by the total number of patients who have the same number of symptoms. To approximate the transition probability between two nodes (originating and terminating), we divided the number of simulated patients that are represented by the terminating node by the number of simulated patients that are represented by nodes characterized by the same number of symptoms as the terminating node, including the terminating node. The error of each node is determined by the sum of the products of the transition probabilities leading to that node subtracted from the state probability of the node. Then, the error of each implementation of the model was defined as the error of the node with the highest absolute value of error (Supplemental Figures 2–13). The transition probabilities signify the likelihoods of transitions from one node to another, and the aggregates of the transition probabilities in a sequence represent the likelihoods of the paths. These paths illustrate the order of symptoms when infected with a respiratory disease by observing the stepwise addition of symptoms when traversing down nodes in the path. The most and least likely paths were determined using a greedy algorithmic approach. This approach consists of selecting local maximum or minimum edges stepwise, which results in a most and least likely path, respectively. If the maximum (or minimum) transition probability from a specific node was within error of other transition probabilities of edges from the same originating node, we grouped the terminating nodes when finding the most (or least) likely path. In these cases, we could not distinguish a difference in likelihood between these specific transitions. The paths create a possible order of symptoms via the poset, each having a specific likelihood of occurrence.
Results
A Possible Order of Discernible Symptoms in COVID-19
The WHO-China Joint Report from February 16 to 24, 2020 includes rates of symptom occurrence at presentation from 55,924 confirmed cases of COVID-19 (8). We identified symptoms that were easily discernible or objective (i.e., fever, cough, diarrhea, and nausea/vomiting) in comparison to other reported symptoms, such as inflammations of blood vessel epithelia (24), neurological effects (25), and rash-like symptoms (26). These symptoms are also common in other respiratory diseases. Thus, we chose to implement these four symptoms in the Stochastic Progression Model (Supplemental Table 1). To confirm the validity of the model, we first determined the possible sequences of symptom occurrence when the probabilities are uniformly random for each symptom. In addition to all possible orders of occurrence of the four symptoms, the diagram displays the most and least likely paths of the four symptoms, depicted by red lines and blue lines, respectively (Figures 1A,B). The most and least likely paths describe the most and least likely series of symptoms that a random infected person from the population in the dataset may experience. In this case, each possible path is equally likely, with no path having any higher probability than any other.
Figure 1. Development of the stochastic progression model for COVID-19. (A) The most likely paths (red) in the Hasse Diagram for symptoms with random likelihoods of occurring. (B) The least likely paths (blue) in the Hasse Diagram for symptoms with random likelihoods of occurring. (C) The most likely (red) and least likely (blue) paths in the Hasse Diagram for symptoms in COVID-19. (D) The most likely order of symptoms in COVID-19 based on our Stochastic Progression Model determined from transition probabilities presented here. (E) The least likely order of symptoms in COVID-19 based on our Stochastic Progression Model determined from transition probabilities presented here. (F) Hasse Diagram of the most likely paths (red) after traveling any forced path (gray) of patients with one symptom. (G) Hasse Diagram of the least likely paths (blue) after traveling any forced path (gray) of patients with one symptom. (H) Hasse Diagram of the most likely paths (red) after traveling any forced path (gray) of patients with two symptoms. (I) Hasse Diagram of the least likely paths (blue) after traveling any forced path (gray) of patients with two symptoms.
We then created another implementation of the Stochastic Progression Model and utilized the data in the WHO-China Joint Report (COVID-19 with N = 55,924) (8). With this implementation, we determined the most and least likely paths (Figure 1C). In this case, a person infected with COVID-19 is most likely to experience symptoms in the order of fever, cough, nausea/vomiting, then diarrhea (Figure 1D). The least likely path starts at diarrhea and nausea/vomiting and is followed by cough, and finally fever (Figure 1E). We confirmed these results with a smaller dataset (COVID-19 with N = 1,099) (Figures 1D,E, and Supplemental Figure 1) (16). The likelihoods of transitioning to fever, 0.769, and then to cough, 0.958, are high, and these observations indicate that a large portion of infected symptomatic patients may follow this path. Finally, this implementation of the model predicts that nausea/vomiting occurs before diarrhea. These two results suggest that in patients with SARS-CoV-2, the body first develops fever, then upper respiratory symptoms and finally symptoms of the upper then lower gastrointestinal (GI) tract.
To further investigate these symptom paths, we implemented the Stochastic Progression Model with the main dataset (COVID-19 with N = 55,924) (8), to determine the likely downstream paths when the first one or two symptoms are forced to a certain state (Figures 1F–I). The gray lines represent the “forced” paths. The rest of the paths were determined as before with a greedy algorithmic approach. We found that the most likely orders of the downstream path are consistent with the most likely orders of the unforced paths. Even if the first symptom is forced to be an unlikely one (e.g., diarrhea), the downstream paths maintain the most likely order of the other three symptoms that we originally determined (Figure 1F). Similarly, the GI tract effects occur first in the forced least likely paths (Figure 1G). When forcing the path one step further by predetermining the first two symptoms for both the most and least likely paths, the findings remain the same (Figures 1H,I).
Order of Discernible Symptoms in COVID-19 Is Independent of Severity of Disease on Admission
The confirmation dataset of COVID-19 cases (N = 1,099) separates the reported 1,099 cases between severe and non-severe patients as designated on admission (16). To investigate the effects of severity on the order of discernible symptoms, we implemented each set of cases separately using the Stochastic Progression Model. We found that the most and least likely paths are identical in severe and non-severe cases and to our original findings above (Figure 2). To illustrate the similarities, the largest difference in likelihood is observed when transitioning from no symptoms to fever in the most likely path. In severe and non-severe cases, the probability is 0.775 and 0.818, respectively, indicating a difference of 0.043. These results suggest that severity does not affect the order of discernible symptoms, and they are consistent with the hypothesis of fever as the first symptom of COVID-19.
Figure 2. The most and least likely paths of discernible symptoms in severe and non-severe COVID-19 cases on admission. (A) Hasse Diagram of the most likely paths (red) and least likely paths (blue) in COVID-19 for cases designated as severe on admission determined from transition probabilities presented here. (B) Hasse Diagram of the most likely paths (red) and least likely paths (blue) in COVID-19 for cases designated as non-severe on admission determined from transition probabilities presented here.
Variation of Order of Discernible Symptoms Between Respiratory Diseases
The four discernible symptoms are objective and relatively easy for patients and clinicians to confirm. So, we developed implementations of the Stochastic Progression Model using these symptoms to determine the most likely and least likely paths for four respiratory diseases: COVID-19, influenza, MERS, and SARS (Figures 3A–D) (6–8). The most likely order of occurrence of symptoms in COVID-19 is fever, cough, nausea/vomiting, and diarrhea (Figure 3A). This path is identical to influenza except the order of the initial two symptoms is switched (Figure 3B). On the other hand, the predicted most likely paths (i.e., fever, cough, diarrhea, and then nausea/vomiting) are the same for MERS and SARS (Figures 3C,D). This order has one difference from the most likely path in COVID-19 in that the order of the final two symptoms are reversed. The least likely path of MERS starts with either nausea/vomiting or diarrhea as the first step. These steps are followed by cough, and finally fever. In contrast, the least likely path of SARS is cough, nausea/vomiting, and diarrhea in any order, and then finally fever. However, the least likely path of symptoms in COVID-19 is the same as the least likely path in MERS, and the least likely path of influenza is unique compared to the other diseases. It is not detectable whether nausea/vomiting or diarrhea are the first symptoms in influenza, but after these two, the least likely path continues from there to fever then cough. This observation further illustrates the strong link of cough to influenza. As for coronavirus-related diseases, the strongest first indicator is fever followed by cough.
Figure 3. The most likely and least likely paths of discernible symptoms in respiratory diseases. (A) The most likely paths (red) and least likely paths (blue) in a Hasse Diagram for COVID-19 symptoms. (B) The most likely paths (red) and least likely paths (blue) in a Hasse Diagram for influenza symptoms. (C) The most likely paths (red) and least likely paths (blue) in a Hasse Diagram for MERS symptoms. (D) The most likely paths (red) and least likely paths (blue) in a Hasse Diagram for SARS symptoms. For each diagram, the most and least likely paths are determined from the transition probabilities that are depicted on the edges. Additionally, error of transition probabilities and sample size (N) are presented.
Comparing the Order of Most Common Symptoms in Respiratory Diseases With COVID-19
Although active surveillance of the order discernible symptoms (i.e., fever, cough, nausea/vomiting, and diarrhea) could be useful due to the distinctive most and least likely paths that we determined, we expanded our analysis to the seven symptoms commonly observed in all four respiratory diseases studied here. So, we created a second set of symptoms that amends sore throat, myalgia, and headache to the original set of symptoms (Supplemental Table 2). The three additional symptoms are more subjective (6–8). The seven-symptom implementation of the Stochastic Progression Model of COVID-19 shows that these additional symptoms did not perturb our initial ordering of fever, coughing, nausea/vomiting, and diarrhea, but instead added another level of intricacy in the middle of the likely paths (Figure 4). We still find that the most likely path first transitions to fever, indicating that fever is the most likely first symptom. From there, the most likely next symptom is cough once again. Then, we observe an undetectable difference in likelihood of transitioning to either sore throat, headache, or myalgia, indicating that all three are likely to occur next before proceeding. The final two nodes are consistent with the four-symptom order by indicating that nausea/vomiting then diarrhea occur last. Although this implementation is more complex because it has seven symptoms, it is consistent with our earlier findings. The most likely path of COVID-19 symptoms is fever, then cough, and next either sore throat, myalgia, or headache, followed by nausea/vomiting, and finally diarrhea, and this order is the same as the one indicated by the implementation developed from the confirmation dataset (COVID-19 with N = 1,099) (Figure 4) (16).
Figure 4. The most likely path of common respiratory symptoms in COVID-19. The most likely path of seven common symptoms of COVID-19, determined by the transition probabilities that are also listed between nodes, of two datasets here.
We also implemented the Stochastic Progression Model with the same seven symptoms in influenza, SARS, and MERS datasets to compare and contrast disease progression with that in COVID-19 (Figure 5) (6–8). The results for influenza indicate that cough or myalgia may occur first (Figure 5A). After these two symptoms occur, the order of symptoms is headache, sore throat and fever. Finally, vomiting/nausea and diarrhea have an undetectable difference in probability of occurring last. The MERS implementation displays a most likely path in which fever will occur first, followed by cough, headache, and then myalgia (Figure 5B). These are followed by an undetectable difference in likelihood of headache and diarrhea occurring. Finally, sore throat and nausea/vomiting will occur last with an undetectable difference. The implementation for SARS shows that fever is most likely to occur first, followed by an undetectable difference in transition probability of cough and myalgia, which is similar to the other coronavirus-related diseases (Figure 5C). Next, headache is most likely. Finally, diarrhea, sore throat and nausea/vomiting occur with an undetectable difference in likelihood.
Figure 5. The most likely paths of symptoms in influenza, MERS, and SARS vs. COVID-19. (A) The most likely path of seven common symptoms of influenza with the transition probabilities listed between nodes. (B) The most likely path of seven common symptoms of MERS with the transition probabilities listed between nodes. (C) The most likely path of seven common symptoms of SARS with the transition probabilities listed between nodes. For each path, the transition probabilities in COVID-19 are listed on the right. The most likely paths for each respective disease here are determined from the transition probabilities listed between nodes on the left.
To illustrate the uniqueness of the most likely path of COVID-19, we found the transition probabilities of the same path in the other respiratory diseases (Figure 6). When comparing and contrasting the probabilities, we found that the implementation representing COVID-19 strongly asserts that the first symptom will be fever and cough will soon follow because the transition probabilities are 0.731 and 0.783, respectively (Figure 6A), whereas the influenza implementation indicates that fever is very unlikely to occur first with a probability of only 0.035 (Figure 6B). Additionally, the implementations of MERS and SARS data also have a high likelihood of transitioning to fever first, with a probability of 0.627 and 0.988, respectively (Figures 6C,D). The second symptom of the most likely path of COVID-19 is cough, with a probability of 0.783, but the others do not have a similar high probability. For example, the respiratory disease with the highest probability at that transition is MERS at 0.536. However, after fever and cough, COVID-19 and the other three respiratory diseases have a similarly high likelihood of the three subjective symptoms (i.e., sore throat, headache, and myalgia). Finally, the most likely path of COVID-19 ends with nausea/vomiting and then diarrhea. These observations are consistent with the symptoms described by the CDC and support the notion that fever followed by cough seems highly likely to be diagnosed as COVID-19 (5).
Figure 6. The most likely path of symptoms in COVID-19 vs. influenza, MERS, and SARS. (A) The most likely path of seven common symptoms of COVID-19 with the transition probabilities listed between nodes. (B) The transition probabilities of the path of influenza. (C) The transition probabilities of the path of MERS. (D) The transition probabilities of the path of SARS. The most likely path here is determined from the transition probabilities listed between nodes for COVID-19.
Also, comparing the transition probabilities of paths in the same disease illustrates the significance of the most likely pathways. For example, the lowest transition probability in the most likely path of influenza is 0.578 (Figure 5A), whereas when analyzing influenza as it traverses down the most likely path of COVID-19, the transition probabilities observed are 0.5 or less (Figure 6B). However, in that same path, the transition probability from fever and cough to fever, cough, sore throat, headache, and myalgia is >0.999. This value displays how unlikely nausea/vomiting and diarrhea are to be initial symptoms of influenza. Additionally, when observing the most likely path of COVID-19, the first two symptoms seem to have a strong probability of occurring in the order of fever and then cough, with a likelihood of 0.731 (Figure 5A). However, the likelihood of cough occurring first in COVID-19 is 0.229, which is a low probability (Figure 5A). This observation further supports the hypothesis of fever occurring first and cough occurring second.
Recall and Selectivity When Linking First Symptom and Disease
The COVID-19 and influenza implementations of the Stochastic Progression Model suggest that there is a high likelihood of fever and cough occurring first, respectively. We desired to find metrics quantifying the possible link between first symptom and these two diseases. So, we determined the recall and the selectivity when using the initial symptom as an indicator of COVID-19 or influenza, with all other possible diseases excluded in a theoretical patient population. First, we simulated patient datasets using reported data that were independent from all previous work that we integrated in our analyses above (Supplemental Table 5) (20). Two simulated patient datasets were created to analyze COVID-19 and influenza separately to portray the specific link of each disease with the corresponding initial symptom that we determined, fever and cough, respectively. The simulated data contained information about the patients’ state of disease (COVID-19, influenza or not) and their first symptom experienced. Based on the information of the first symptom alone, we categorized the simulated patient data as infected with COVID-19 or not and influenza or not. The recall was calculated as the number of simulated patients that we correctly identified as having the disease over the number of simulated patients that truly had the disease (27). Selectivity was defined here as the number of simulated patients that we correctly identified as not having the disease over the number of simulated patients that truly did not have the disease (28). For both diseases, we performed this analysis for five simulated samples of different sizes, each containing 5% infected individuals. We repeated this process 10 times and calculated the average and standard deviation across each sample size for both COVID-19 and influenza (Tables 1, 2).
Table 1. Recall and selectivity of linking fever as a first symptom of patients with COVID-19.
Table 2. Recall and selectivity of linking cough as a first symptom of patients with influenza.
The recall ranges from 0.966 to 0.990 with a standard deviation of 0.031 and 0.021, respectively when analyzing the link between COVID-19 and fever as a first symptom. The maximum standard deviation of any sample size is 0.063 for the mean of 0.980. On the other hand, the selectivity of fever as a first symptom of COVID-19 ranges from 0.661 to 0.668 with a standard deviation of 0.030 and 0.020, respectively, and 0.030 is the maximum standard deviation with corresponding means of 0.661 and 0.665 (Table 1). As for cough as a first symptom of influenza, the recall ranges from 0.765 to 0.820 with corresponding standard deviations 0.092 and 0.067. The highest standard deviation is 0.110 with a mean of 0.810, and the selectivity ranges from 0.362 to 0.369 with standard deviations of 0.014 and 0.031, respectively, and the maximum standard deviation is 0.031 (Table 2).
The recall in both cases is lower than the selectivity, and this observation indicates that this analysis categorizes patients as infected when they are not, but the high recall indicates that most infected patients did align with the first symptom that we predicted. In the future, we expect to confirm this analysis with data on first symptoms, as opposed to simulated data, but the purpose of this analysis was to display that further study of order of symptoms might lead to earlier recognition.
Discussion
In this study, we found evidence that supports the notion that there is a most common order of discernible symptoms in COVID-19 that is also different from other prominent respiratory diseases. The most likely initial symptom is fever in the three diseases studied that are caused by coronaviruses (i.e., COVID-19, SARS, and MERS) and cough in influenza. The most likely order of the four easily discernible symptoms is identical in MERS and SARS, but the most likely path of COVID-19 has one key difference. The first two symptoms of COVID-19, SARS, and MERS are fever and cough. However, the upper GI tract (i.e., nausea/vomiting) seems to be affected before the lower GI tract (i.e., diarrhea) in COVID-19, which is the opposite from MERS and SARS. In all diseases, we found that fever and cough occur before nausea/vomiting and diarrhea. When observing the set of seven symptoms including three subjective ones (i.e., sore throat, headache, and myalgia), we found that the initial symptoms of the most likely path are the same as in the most likely path of the four discernible symptoms. Also, in both the four and seven symptoms implementations, the GI tract symptoms are last. A separate MERS dataset included the initial symptoms of patients on admission, which listed the symptoms from highest to lowest probability as fever, myalgia, cough, and diarrhea (18). This order is similar to the most likely path that we determined. A very small percent of patients experienced diarrhea as an initial symptom. This report suggests that diarrhea as an early symptom indicates a more aggressive disease, because each patient in this dataset that initially experienced diarrhea had pneumonia or respiratory failure eventually (Supplemental Table 3). We propose that these patients may be experiencing a more aggressive form of the disease and have accelerated through the most likely path, having already experienced diarrhea. These findings align with another dataset provided for SARS, which also contained the percentage of the various symptoms to be reported first (Supplemental Table 4). The highest reported symptom is fever, followed by cough or dyspnea, and then finally, a small percent of patients reported diarrhea (19). This order confirms the most likely paths that we have determined. The observation that diarrhea was very uncommon as a first symptom and had a non-zero probability of occurrence is consistent with our analysis. This aligns with our hypothesis that early occurrence of diarrhea implies that those patients may have a much more aggressive form of the disease.
The simulation data used to approximate the state and transition probabilities in the Stochastic Progression Model relies on the assumption that symptoms included in the model are independent. Using the definition of independence, we observed the individual probabilities of fever and cough in a dataset from a case study of influenza, and we found that the product of the individual probabilities of fever and cough is almost equal to the probability of both occurring (21). Considering this outcome, we proceeded under the assumption of independence, which we will reevaluate when more symptom data becomes available. We simulated combinations of symptoms for 500,000 patients, which we chose because it was the lowest attempted number that empirically produced the theoretical expected outcome for random frequency symptoms: that all paths would be equally likely, up to 100ths of a decimal place. We then utilized these simulated patients to approximate the state probabilities and transition probabilities described above.
This study supports the idea that symptoms occur in a predictable order, but future work is needed to improve aspects of the Stochastic Progression Model and confirm the results found here. Our finding that COVID-19 first presents with a fever supports the recommended measures by the CDC which state that the public should take their temperature at home and when entering facilities as an early checking method (29). This application of the Stochastic Progression Model may be improved if there were objective ways to measure the more subjective symptoms (i.e., sore throat, headache, and myalgia). Also, improved error calculations of the transition probabilities would lead to more accurate results. Our current error calculation is conservative, because when more symptoms were added, we observed that the error compounded as we progressed further down the paths (Supplemental Figures 2–13). The conservative error estimate creates issues in discerning the difference in probabilities of symptoms. Specifically, in implementations of seven symptoms, the likelihoods are more difficult to ascertain due to subjective reporting and compounding error calculations. Datasets that contain the order of symptoms for each patient would lower the error. Additionally, these sorts of datasets would better the approximations of the transition probabilities and increase accuracy. This improvement could be achieved by physicians implementing the practice of recording the order of occurrence of symptoms. With this information, we may approximate the likelihood of a patient acquiring a symptom based on their current symptoms with patient data instead of simulations based on frequency. Applying objective criteria for symptoms, improving error calculations, and collecting the order of symptoms would not only allow us to improve our findings here, but also allow the Stochastic Progression Model to predict orders of a larger set of symptoms. The optimal form of the Stochastic Progression Model would be developed by determining state probabilities from observed true frequencies of patients’ symptoms and determining transition probabilities from the patients’ true order of symptoms. However, until this data is available, improved approximations, simulations and error calculations are needed.
Furthermore, when analyzing fever as the first symptom of COVID-19, a low selectivity indicates a high Type I error (i.e., rate of false positive), and a high recall indicates a low Type II error (i.e., rate of false negative). We found a moderate selectivity value and as a result, a moderate Type I error in this case. This Type I error is acceptable in our use of investigating fever as an initial symptom of COVID-19, because it suggests that more people get tested who are not infected, rather than less people get tested who are infected, as with Type II error (30). We are not proposing initial symptom as a diagnostic test, but instead as a possible sign to get tested. COVID-19 outbreaks in clusters, and these unusual clusters of disease are characteristic of a pandemic disease that must be addressed immediately with aggressive testing to curb transmission (31).
The importance of knowing first symptoms is rooted in the need to stop the spread of COVID-19, a disease that is two to three times more transmissible than influenza and results in outbreaks of clusters (3, 4). There is a heightened risk in COVID-19 being passed on, so faster testing and social distancing are important, especially when social distancing and quarantine measures are relaxed. Our results assert that fever is the most likely symptom to occur first in symptomatic adult patients with COVID-19. We hope that the hypotheses generated in this work are tested with prospective clinical data to confirm that a cough occurs first more often in influenza and likewise fever in COVID-19. We believe that early detectors that any individual can recognize to seek medical attention earlier is useful. In addition, datasets that contain information of symptom order and strains of COVID-19 allow for further studies that may determine whether onset of symptoms vary in specific strains (32), and whether risk factors, such as obesity (33), and environmental factors, such as temperature (34) affect symptom order. To slow the spread of COVID-19, our results support the practice that fever should be tested before allowing entry to facilities and that those with fever should immediately seek medical attention for diagnosis and contact tracing. Such measures as these may help to reduce transmission despite the high contagion of SARS-CoV-2.
Data Availability Statement
Publicly available datasets were analyzed for this study. These can be found here: https://www.who.int/publications-detail/report-of-the-who-china-joint-mission-on-coronavirus- disease-2019-(covid-19), https://www.nejm.org/doi/full/10.1056/NEJMoa2002032, https://jamanetwork.com/journals/jamainternalmedicine/fullarticle/485554, https://onlinelibrary.wiley.com/doi/full/10.1111/resp.13196, https://www.journalofinfection.com/article/S0163-44531630209-2/abstract, https://jamanetwork.com/journals/jama/fullarticle/196681, https://jamanetwork.com/journals/jama/fullarticle/2761044, https://www.cambridge.org/core/journals/infection-control-and-hospital-epidemio logy/article/symptoms-of-influenza-virus-infection-in-hospitalized-patients/8F1B478BA4B861D356393EA77AD8B83B#.
Author Contributions
JL and JH conceived the model. JL and JM conceived the project. JL created the model. JL, MM, and JM analyzed results. JL and MM wrote the manuscript. PK and JH supervised the project. All authors read, edited, and approved the final manuscript.
Funding
This work was supported by the National Cancer Institute (Award Number U54CA143906 and P30CA014089) and the Carol Vassiliadis fellowship. JL was supported by the USC Dana and David Dornsife College of Letters, Arts and Sciences, and the Schlegel Family Endowment Fellowship.
Conflict of Interest
MM is employed by the company Nexus Development PA LLC. JM is employed by the company NanoCarrier Co., Ltd.
The remaining authors declare that the research was conducted in the absence of any commercial or financial relationships that could be construed as a potential conflict of interest.
Acknowledgments
We wish to thank Dr. Jorge Nieva for discussions and advisement and Libere Ndacayisaba for critical reading of the manuscript.
Supplementary Material
The Supplementary Material for this article can be found online at: https://www.frontiersin.org/articles/10.3389/fpubh.2020.00473/full#supplementary-material
References
1. Dong E, Du H, Gardner L. An interactive web-based dashboard to track COVID-19 in real time. Lancet Infectious Dis. (2020) 20:533–4. doi: 10.1016/S1473-3099(20)30120-1
2. Cascella M, Rajnik M, Cuomo A, Dulebohn SC, Di Napoli R. Features, Evaluation and Treatment Coronavirus (COVID-19). StatPearls Publishing (2020).
3. Anderson RM, Heesterbeek H, Klinkenberg D, Hollingsworth TD. How will country-based mitigation measures influence the course of the COVID-19 epidemic? Lancet. (2020) 395:931–4. doi: 10.1016/S0140-6736(20)30567-5
4. Sun K, Chen J, Viboud C. Early epidemiological analysis of the coronavirus disease 2019 outbreak based on crowdsourced data: a population-level observational study. Lancet Digital Health. (2020) 2:E201–8. doi: 10.1016/S2589-7500(20)30026-1
5. Sohrabi C, Alsafi Z, O’Neill N, Khan M, Kerwan A, Al-Jabir A, et al. World Health Organization declares global emergency: a review of the 2019 novel coronavirus (COVID-19). Int J Surg. (2020) 76:71–6. doi: 10.1016/j.ijsu.2020.02.034
6. Monto AS, Gravenstein S, Elliott M, Colopy M, Schweinle J. Clinical signs and symptoms predicting influenza infection. Archiv Internal Med. (2000) 160:3243–7. doi: 10.1001/archinte.160.21.3243
7. Yin Y, Wunderink RG. MERS, SARS and other coronaviruses as causes of pneumonia. Respirology. (2018) 23:130–7. doi: 10.1111/resp.13196
8. Organization WH Organization WH. Report of the WHO-China Joint Mission on Coronavirus Disease 2019 (Covid-19). (2020). Available online at: https://www.who.int/docs/default-source/coronaviruse/who-china-joint-mission-on-covid-19-final-report.pdf (accessed April 12, 2020).
9. Reed C, Kim IK, Singleton JA, Chaves SS, Flannery B, Finelli L, et al. Estimated influenza illnesses and hospitalizations averted by vaccination—United States, 2013–14 influenza season. MMWR Morbidity mortality Weekly Report. (2014) 63:1151–4.
10. Newton PK, Mason J, Bethel K, Bazhenova LA, Nieva J, Kuhn P. A stochastic Markov chain model to describe lung cancer growth and metastasis. PLoS ONE. (2012) 7:34367. doi: 10.1371/journal.pone.0034637
11. Newton PK, Mason J, Bethel K, Bazhenova L, Nieva J, Norton L, et al. Spreaders and sponges define metastasis in lung cancer: a Markov chain Monte Carlo mathematical model. Cancer Res. (2013) 73:2760–9. doi: 10.1158/0008-5472.CAN-12-4488
12. Bazhenova L, Newton P, Mason J, Bethel K, Nieva J, Kuhn P. Adrenal metastases in lung cancer: clinical implications of a mathematical model. J Thoracic Oncol. (2014) 9:442–6. doi: 10.1097/JTO.0000000000000133
13. Newton PK, Mason J, Hurt B, Bethel K, Bazhenova L, Nieva J, et al. Entropy, complexity, and Markov diagrams for random walk cancer models. Sci Rep. (2014) 4:7558. doi: 10.1038/srep07558
14. Newton PK, Mason J, Venkatappa N, Jochelson MS, Hurt B, Nieva J, et al. Spatiotemporal progression of metastatic breast cancer: a Markov chain model highlighting the role of early metastatic sites. NPJ Breast Cancer. (2015) 1:1–9. doi: 10.1038/npjbcancer.2015.18
15. Eriksson K, Jonsson M, Sjöstrand J. Markov chains on graded posets. Order. (2018) 35:93–109. doi: 10.1007/s11083-016-9420-1
16. Guan WJ, Ni ZY, Hu Y, Liang WH, Ou CQ, He JX, et al. Clinical characteristics of coronavirus disease 2019 in China. N Engl J Med. (2020) 382:1708–20. doi: 10.1056/NEJMoa2002032
17. Chan MC, Lee N, Chan PK, To K, Wong RY, Ho W-S, et al. Seasonal influenza A virus in feces of hospitalized adults. Emerg Infectious Dis. (2011) 17:2038. doi: 10.3201/eid1711.110205
18. Ko J-H, Park GE, Lee JY, Lee JY, Cho SY, Ha YE, et al. Predictive factors for pneumonia development and progression to respiratory failure in MERS-CoV infected patients. J Infection. (2016) 73:468–75. doi: 10.1016/j.jinf.2016.08.005
19. Booth CM, Matukas LM, Tomlinson GA, Rachlis AR, Rose DB, Dwosh HA, et al. Clinical features and short-term outcomes of 144 patients with SARS in the greater Toronto area. JAMA. (2003) 289:2801–9. doi: 10.1001/jama.289.21.JOC30885
20. Wang D, Hu B, Hu C, Zhu F, Liu X, Zhang J, et al. Clinical characteristics of 138 hospitalized patients with 2019 novel coronavirus–infected pneumonia in Wuhan, China. JAMA. (2020) 323:1061–9. doi: 10.1001/jama.2020.1585
21. Van den Dool C, Hak E, Wallinga J, Van Loon A, Lammers J, Bonten M. Symptoms of influenza virus infection in hospitalized patients. Infection Control Hospital Epidemiol. (2008) 29:314–9. doi: 10.1086/529211
22. Ciomek K. hasseDiagram: Drawing Hasse Diagram. (2017). Available online at: https://CRAN.R-project.org/package=hasseDiagram (accessed April 09, 2020).
23. Team RC. R: A Language and Environment for Statistical Computing. R Foundation for Statistical Computing. (2018). Available online at: https://www.R-project.org/ (accessed February 13, 2019).
24. Varga Z, Flammer AJ, Steiger P, Haberecker M, Andermatt R, Zinkernagel AS, et al. Endothelial cell infection and endotheliitis in COVID-19. Lancet. (2020) 395:1417–8. doi: 10.1016/S0140-6736(20)30937-5
25. Wu Y, Xu X, Chen Z, Duan J, Hashimoto K, Yang L, et al. Nervous system involvement after infection with COVID-19 and other coronaviruses. Brain Behavior Immunity. (2020) 87:18–22. doi: 10.1016/j.bbi.2020.03.031
26. Diaz-Guimaraens B, Dominguez-Santas M, Suarez-Valle A, Pindado-Ortega C, Selda-Enriquez G, Bea-Ardebol S, et al. Petechial skin rash associated with severe acute respiratory syndrome coronavirus 2 infection. JAMA Dermatol. (2020) 156:820–2. doi: 10.1001/jamadermatol.2020.1741
27. Powers DMW. Evaluation: from precision, recall and fmeasure to ROC, informedness, markedness and correlation. J Mach Learn Technol. 2:37–63.
28. Lozano J, Santos J, Horrillo M. Classification of white wine aromas with an electronic nose. Talanta. (2005) 67:610–6. doi: 10.1016/j.talanta.2005.03.015
29. Ng Y, Li Z, Chua YX, Chaw WL, Zhao Z, Er B, et al. Evaluation of the effectiveness of surveillance and containment measures for the first 100 patients with COVID-19 in Singapore–January 2–February 29, 2020. Centers Dis Control Prev. (2020) 69:307–11. doi: 10.15585/mmwr.mm6911e1
30. Pericchi L, Pereira C. Adaptative significance levels using optimal decision rules: balancing by weighting the error probabilities. Brazil J Probabil Statist. (2016) 30:70–90. doi: 10.1214/14-BJPS257
31. Hitchcock P, Chamberlain A, Van Wagoner M, Inglesby TV, O’Toole T. Challenges to global surveillance and response to infectious disease outbreaks of international importance. Biosecurity Bioterrorism. (2007) 5:206–27. doi: 10.1089/bsp.2007.0041
32. Tang X, Wu C, Li X, Song Y, Yao X, Wu X, et al. On the origin and continuing evolution of SARS-CoV-2. Natl Sci Rev. (2020) 7:nwaa036. doi: 10.1093/nsr/nwaa036
33. Lighter J, Phillips M, Hochman S, Sterling S, Johnson D, Francois F, et al. Obesity in patients younger than 60 years is a risk factor for Covid-19 hospital admission. Clin Infect Dis. (2020) 71:ciaa415. doi: 10.1093/cid/ciaa415
Keywords: COVID-19, Markov, probability, symptoms, stochastic, model, disease, influenza
Citation: Larsen JR, Martin MR, Martin JD, Kuhn P and Hicks JB (2020) Modeling the Onset of Symptoms of COVID-19. Front. Public Health 8:473. doi: 10.3389/fpubh.2020.00473
Received: 13 April 2020; Accepted: 27 July 2020;
Published: 13 August 2020.
Edited by:
Alexander Rodriguez-Palacios, Department of Medicine, Case Western Reserve University, United States
Reviewed by:
Herve Seligmann, The Hebrew University of Jerusalem, Israel
Tauqeer Hussain Mallhi, Department of Clinical Pharmacy, College of Pharmacy, Al Jouf University, Saudi Arabia
Copyright © 2020 Larsen, Martin, Martin, Kuhn and Hicks. This is an open-access article distributed under the terms of the Creative Commons Attribution License (CC BY). The use, distribution or reproduction in other forums is permitted, provided the original author(s) and the copyright owner(s) are credited and that the original publication in this journal is cited, in accordance with accepted academic practice. No use, distribution or reproduction is permitted which does not comply with these terms.
*Correspondence: Peter Kuhn, pkuhn@usc.edu; James B. Hicks, jameshic@usc.edu
Commenta per primo